SAT Math formula sheet · all 24 · Problem-Solving and Data Analysis · #18 of 24

Margin of error on the SAT: How It Is Tested

Inference from sample statistics and margin of error

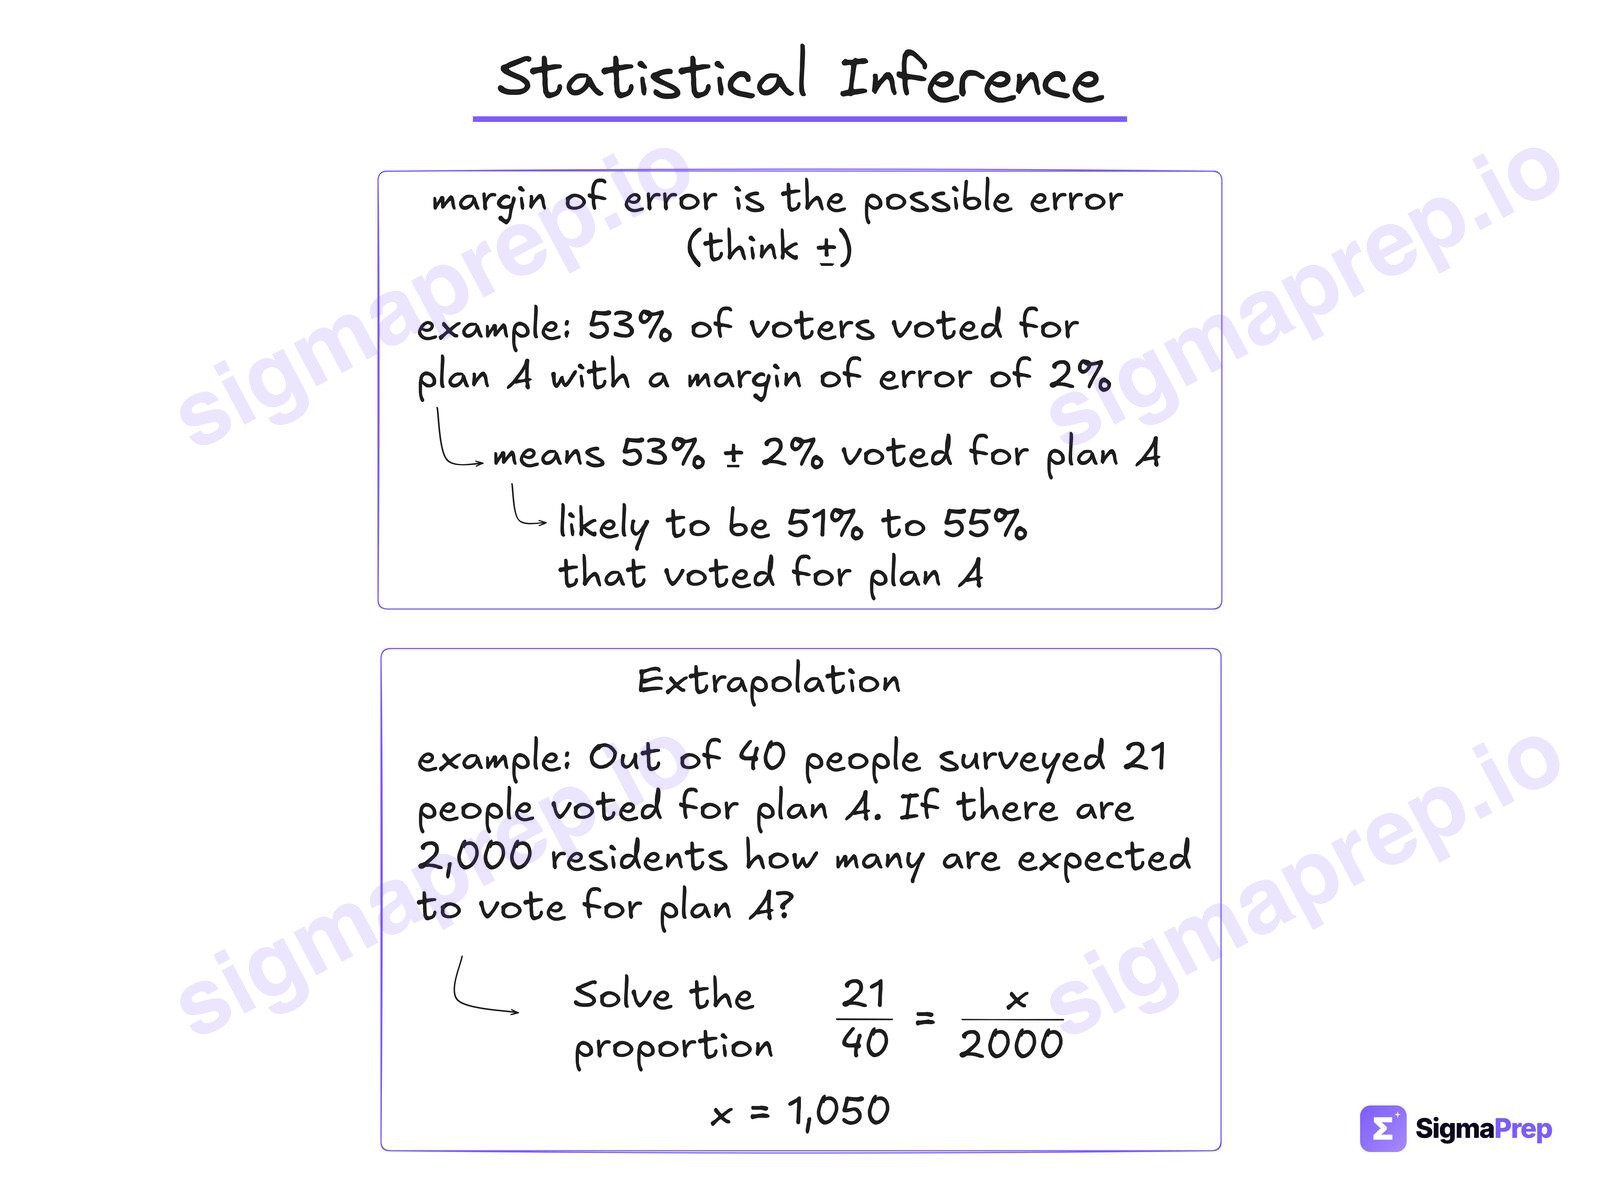
Statistical Inference diagram for the SAT: Margin of error is a plus or minus around the reported number: the true value is most likely between the estimate minus
What it is really testingMargin of error is a plus or minus around the reported number: the true value is most likely between the estimate minus the margin and the estimate plus the margin. If they give you the range instead, the margin is the distance from the middle to one end, not the whole width. For sample-to-population questions, set up the proportion and scale it up to the population.

The question from the sheet

Medium
SAT Problem-Solving and Data Analysisanswer A
Researchers studied a sample of a species of moth from a certain forest. The researchers found that the mean wingspan of moths in the sample was 24.8324.83 millimeters. Based on the sample mean and margin of error, the researchers estimated that the mean wingspan of all moths of this species from this forest was between 23.9623.96 and 25.7025.70 millimeters. What is the margin of error, in millimeters?
0.870.87
B1.741.74
C23.9623.96
D24.8324.83

How the diagram applies

  1. The estimate sits in the middle of the interval: 24.8324.83. The margin of error is the ±\pm, the distance from the middle to either end.
  2. 24.8323.96=0.8724.83 - 23.96 = 0.87, and 25.7024.83=0.8725.70 - 24.83 = 0.87.
  3. Choice B, 1.741.74, is the whole width of the interval, not the ±\pm.

Answer: A

That is 1 of 24.

The whole sheet is one page per formula, each one solved on a real SAT question. Print it, stick it on the wall, scan any diagram to get back here.

The PDF needs no account. The video, the clean diagrams and practice on this skill need a free one, and never a card.

All 24 diagrams

Common Questions

It comes up as an SAT inference from sample statistics and margin of error question. Margin of error is a plus or minus around the reported number: the true value is most likely between the estimate minus the margin and the estimate plus the margin. If they give you the range instead, the margin is the distance from the middle to one end, not the whole width. For sample-to-population questions, set up the proportion and scale it up to the population.

The estimate sits in the middle of the interval: 24.83. The margin of error is the , the distance from the middle to either end. 24.83 - 23.96 = 0.87, and 25.70 - 24.83 = 0.87. Choice B, 1.74, is the whole width of the interval, not the .

No. The SAT reference sheet is twelve geometry formulas and three notes, and Statistical Inference is not one of them. It is one of the 24 things the test expects you to know without being given them. See what the reference sheet does cover at /blog/sat-math-reference-sheet.