Students ask for this one constantly, under almost every video: "is there a sheet with all the SAT math formulas?" There was not, so I drew one. But it is not the sheet you might expect, and the difference matters.
What the official SAT reference sheet gives you, and what it does not
Full breakdown, formula by formula: SAT Math reference sheet, explained.
Every math question on the digital SAT has a reference sheet one click away. It has the basics: area of a circle, triangle, and rectangle, the Pythagorean theorem, the two special right triangles, and the volume formulas for a box, cylinder, sphere, cone, and pyramid. You do not need to memorize any of that. It is handed to you.
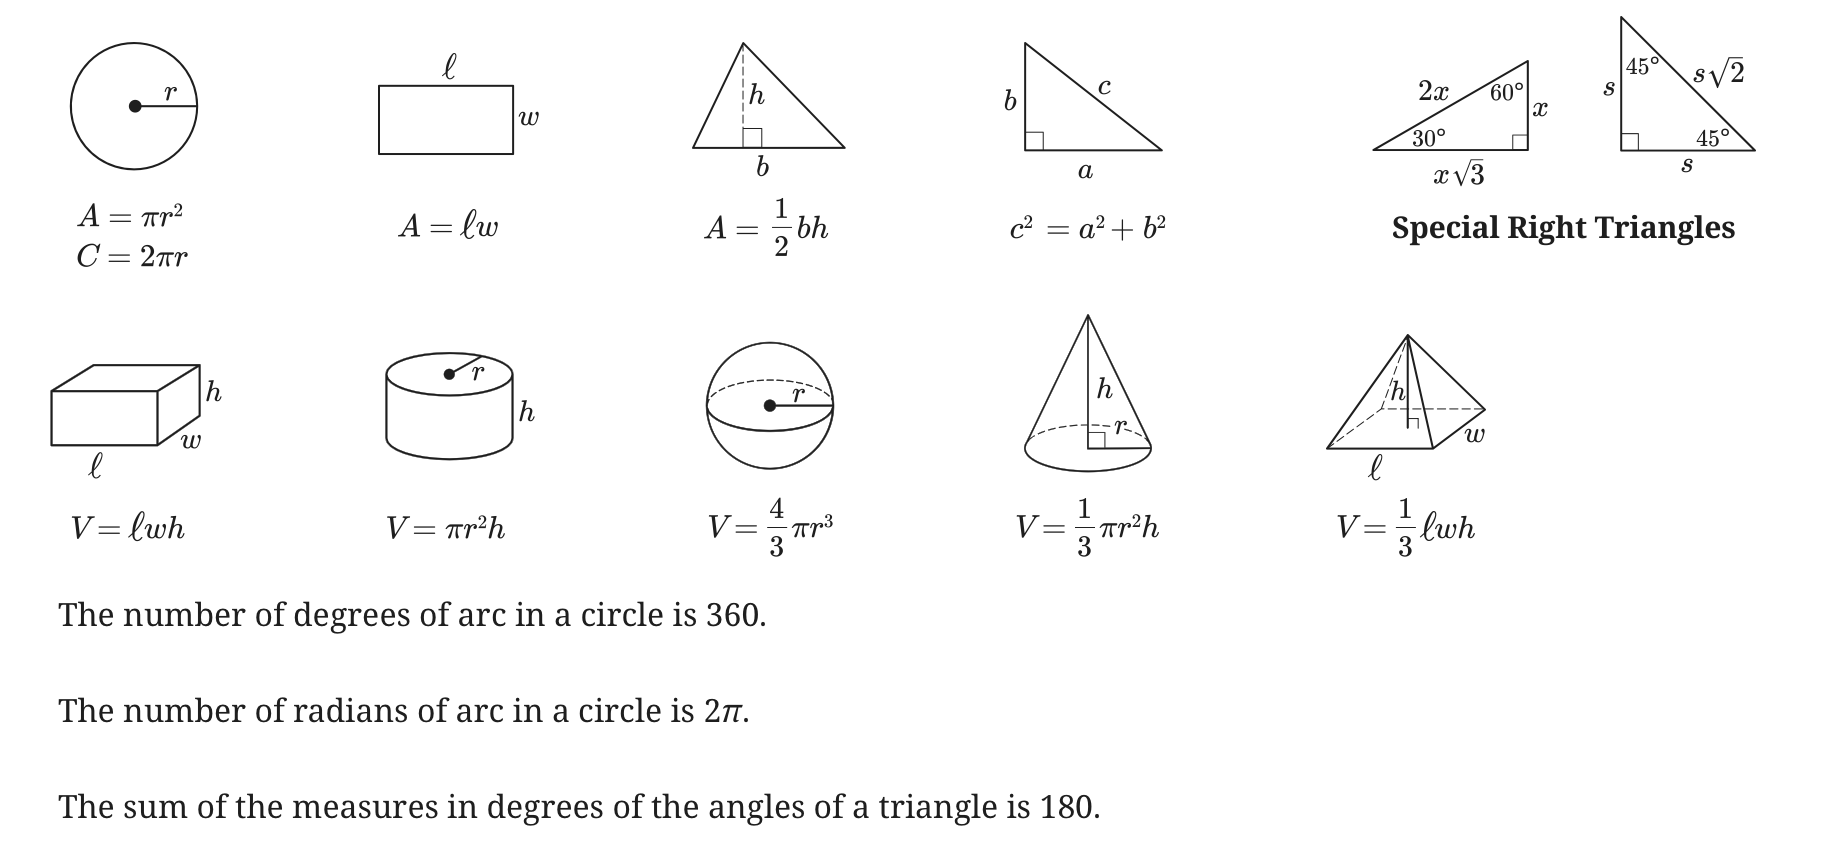
What the test does not hand you is everything else, and most of it is not really a formula. It is an idea you have to recognize on sight: what the slope means in a word problem, which form of a quadratic shows the vertex, why "given that" changes the denominator, why same-side interior angles add to 180 instead of being equal. Nobody prints those on a sheet, so students walk in without them.
That is what these 24 diagrams are. One idea per diagram, drawn the way I draw it on the whiteboard in the videos, in the order the test is organized. Every diagram is below. The PDF version puts a real SAT question next to each one, solved with it, with a code that opens the video where it is solved. It is free, and you do not need an account to download it.
Get the PDF free → No sign-up, no email.
Prefer them one at a time? All 24 have their own page, each with the diagram, the formula, and a real SAT question solved with it.
Algebra
About 35% of the section. Lines, systems, and what the numbers in a linear model mean.
1. Slope-Intercept Form Interpretation
Linear functions
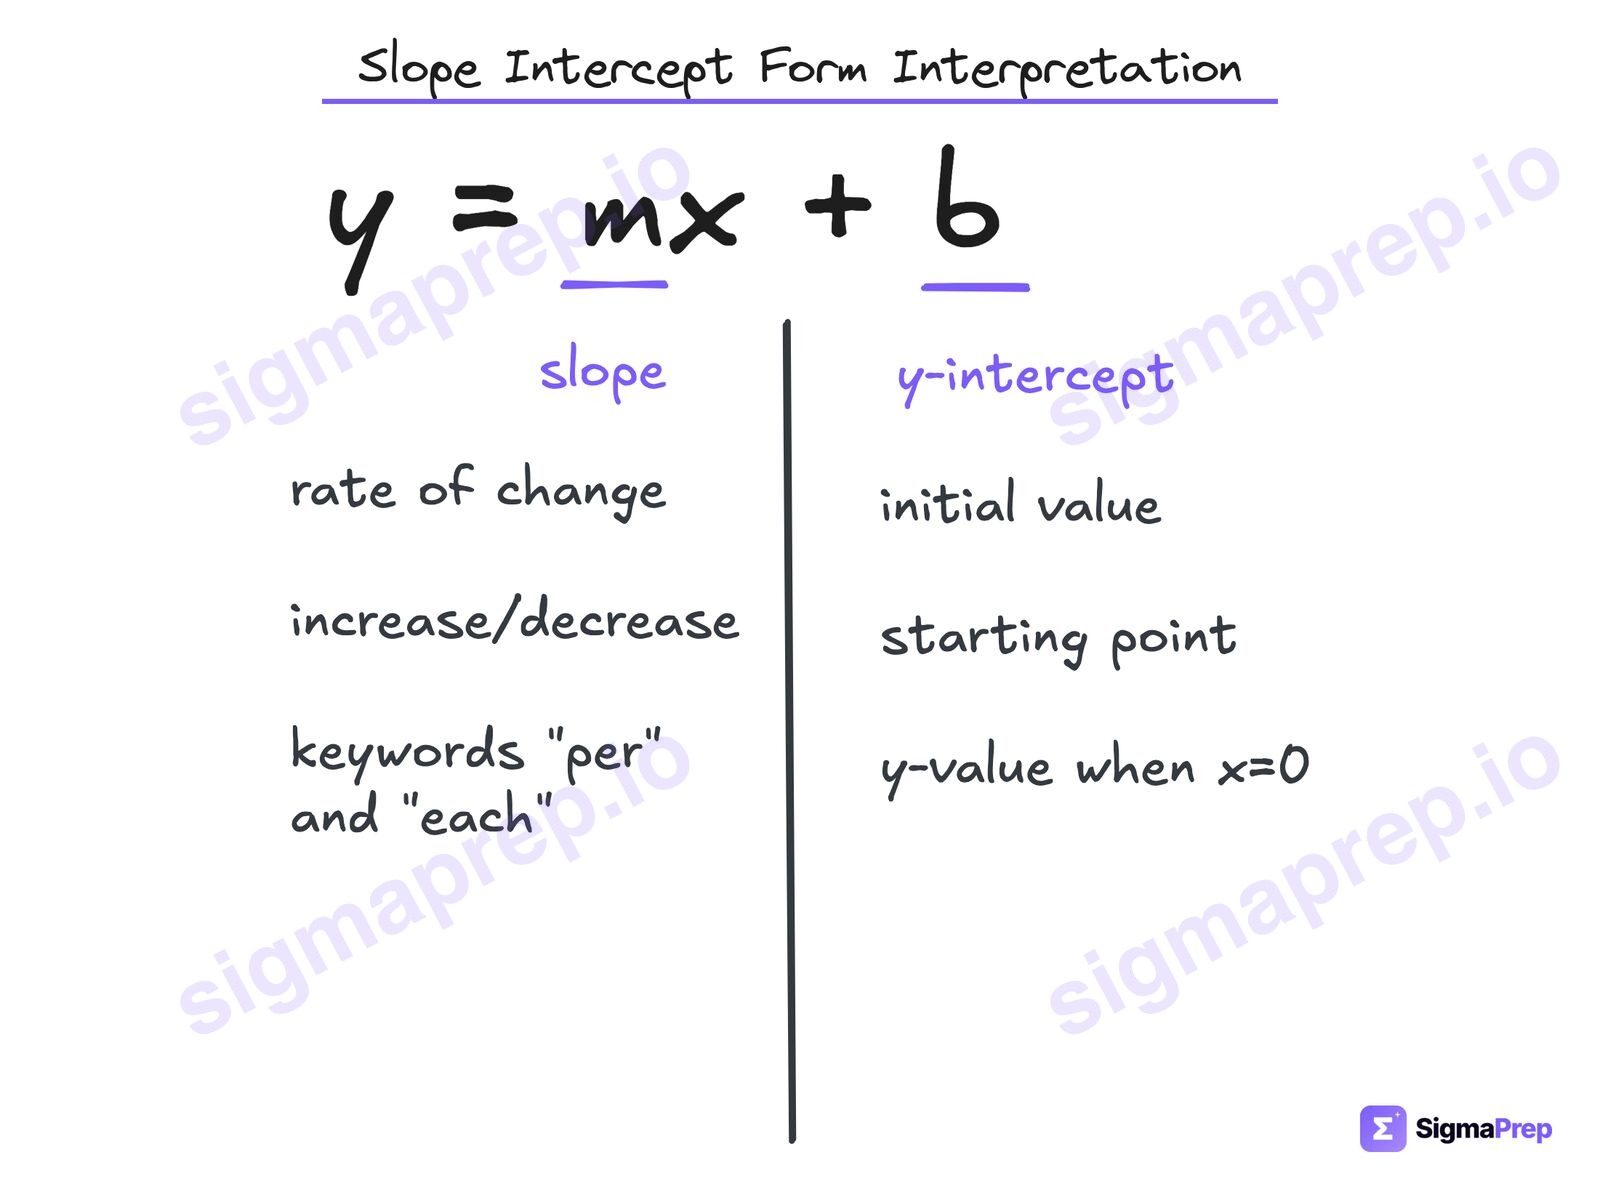
y = mx + bm is the slope · b is the y-intercept
Notes: Slope is always attached to the variable, and the keywords are per and each. Slope is the change in y for ONE change in x.
Slope-Intercept Form Interpretation explained, with a solved SAT question →
2. Parallel and Perpendicular
Linear equations in two variables
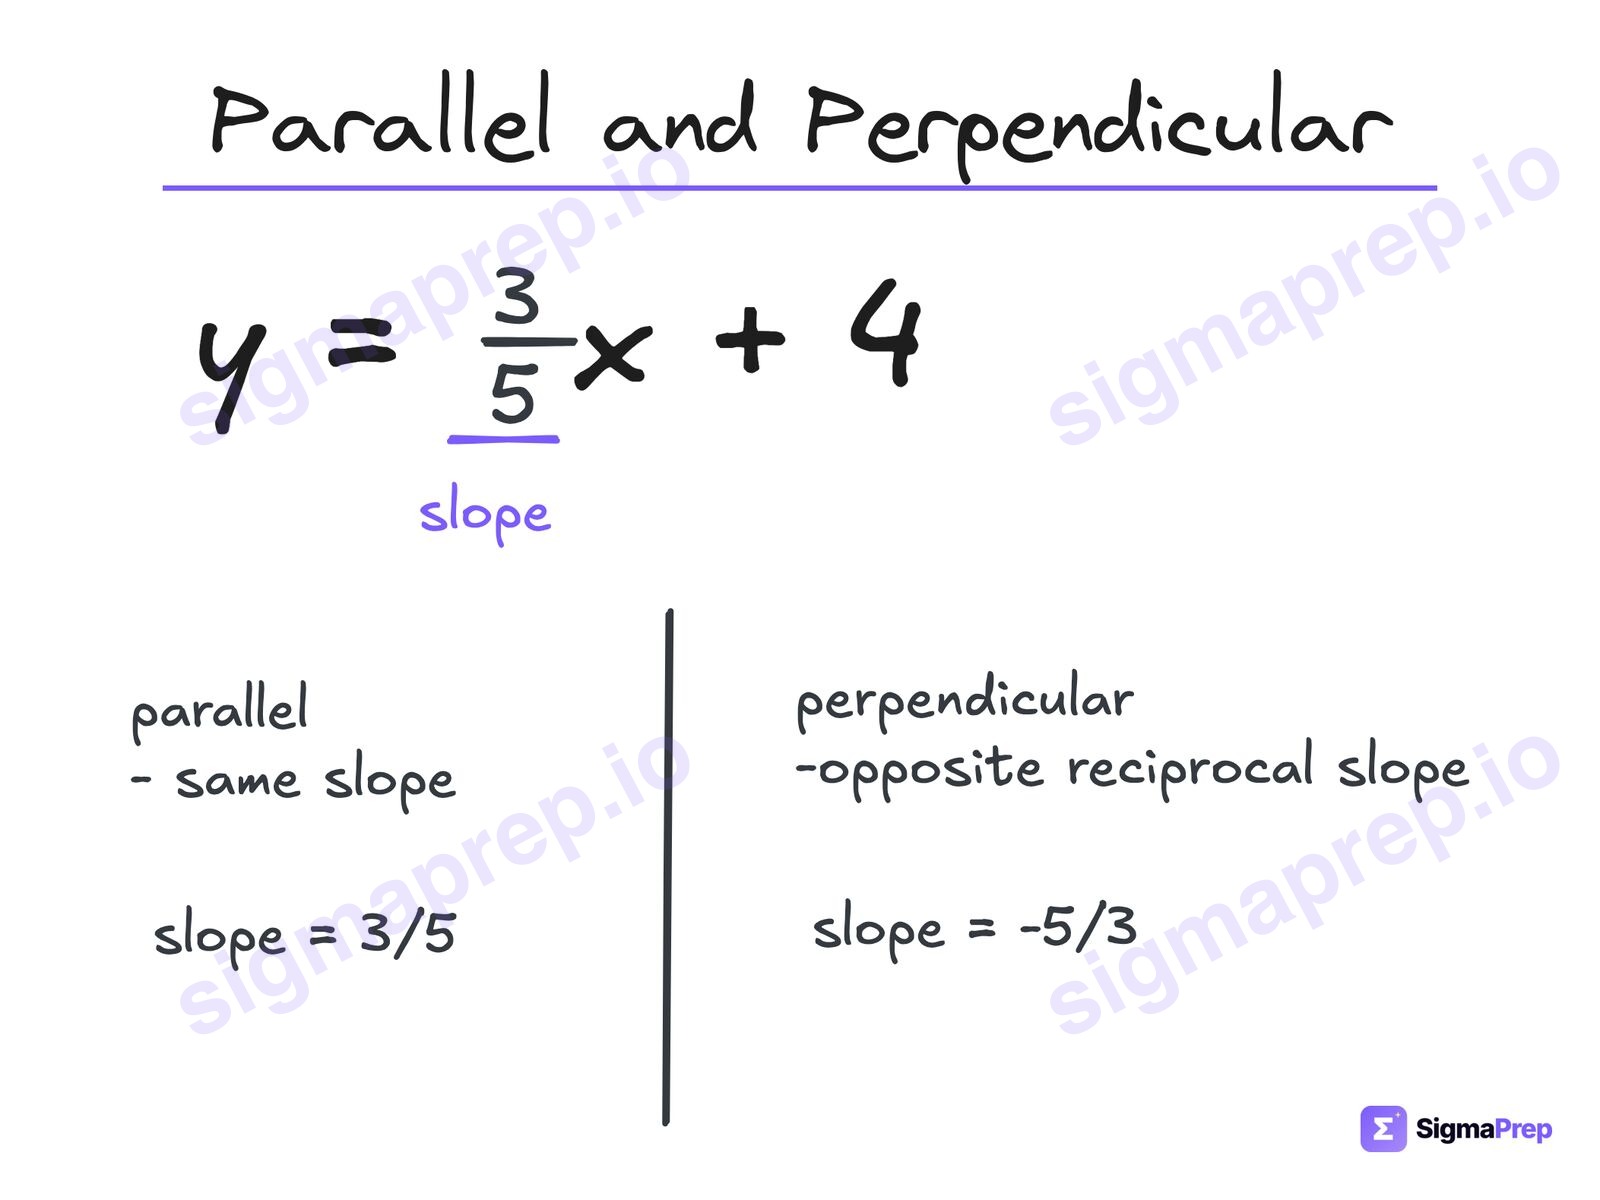
parallel: m₂ = m₁perpendicular: m₂ = −1/m₁y = 3/5x + 4 → parallel 3/5, perpendicular −5/3
Notes: You can only read the slope in slope-intercept form, so isolate y first. Perpendicular is opposite reciprocal: flip the sign AND flip the fraction.
Parallel and Perpendicular explained, with a solved SAT question →
3. No Solution and Infinite Solutions
Linear equations in one variable
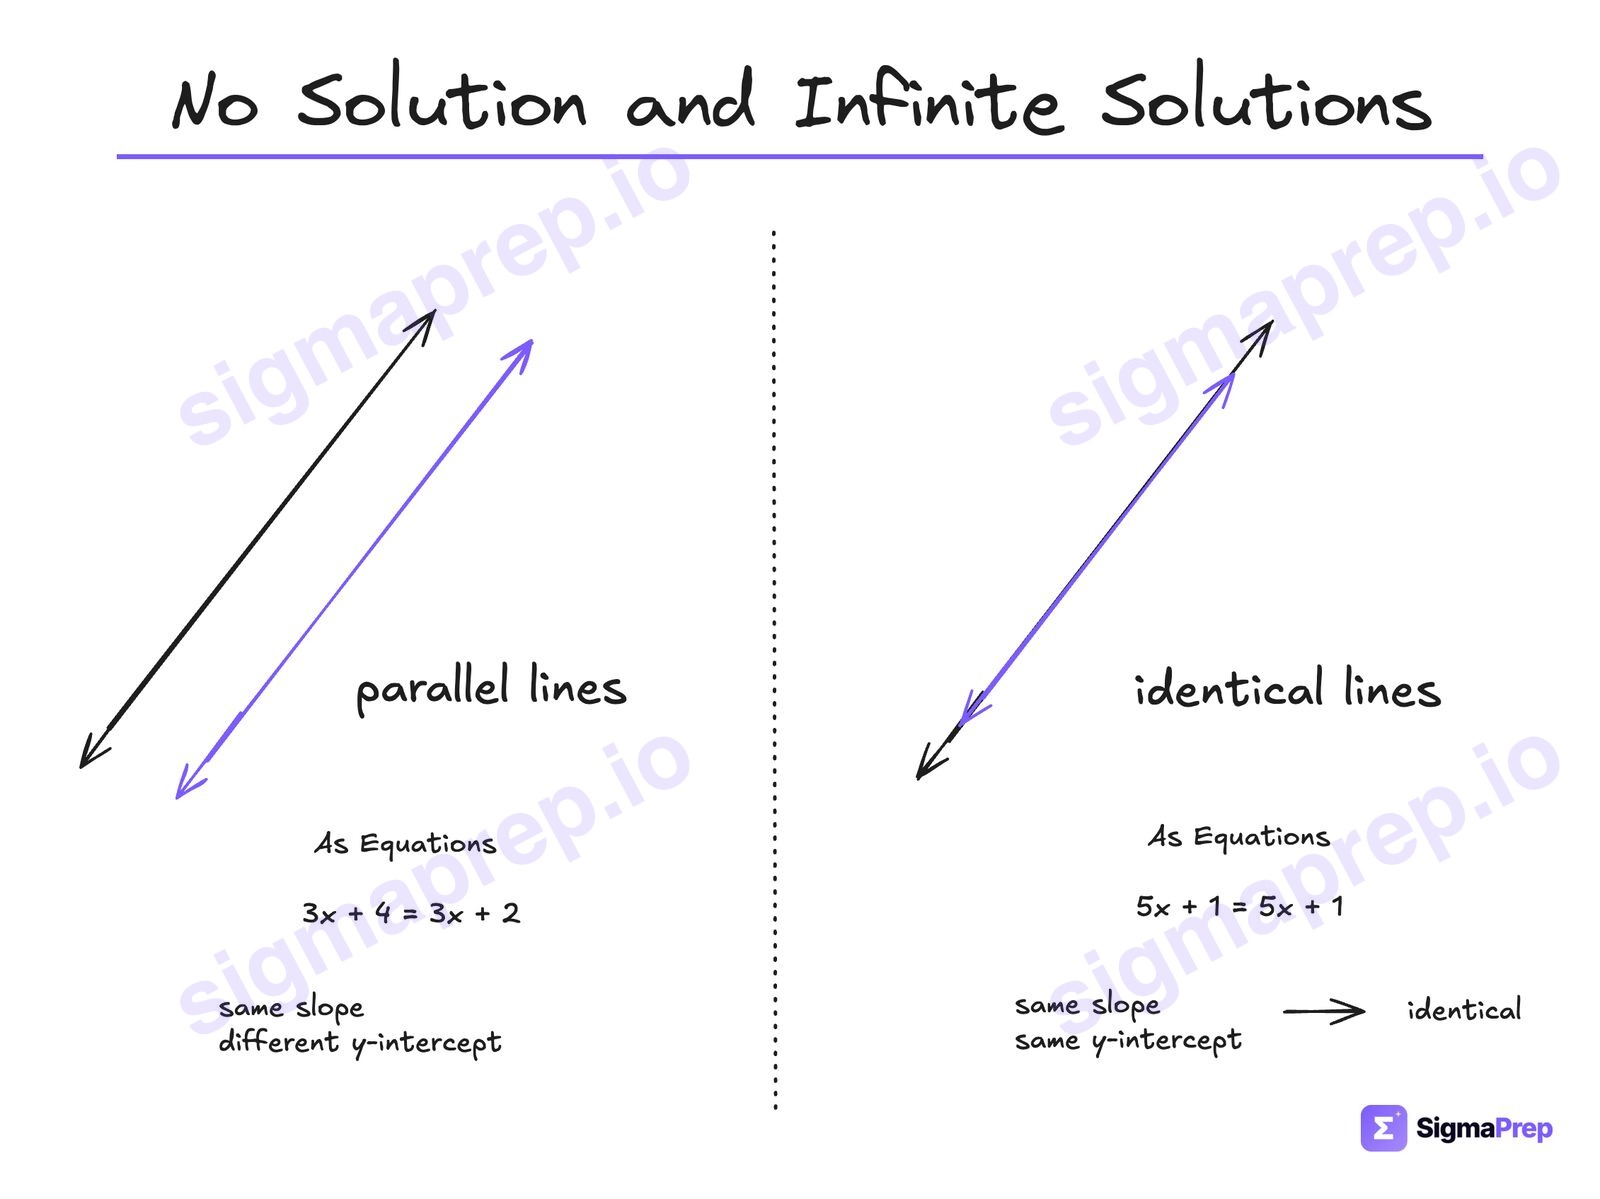
no solution: 3x + 4 = 3x + 2infinitely many: 5x + 1 = 5x + 1Same slope with a different intercept, against the same line twice
Notes: No solution means parallel lines: same slope, different y-intercept. Infinitely many solutions means the same line: same slope and the same y-intercept. Get both sides into slope-intercept form, then match the slopes (and, for infinite, the intercepts) and solve for the constant.
No Solution and Infinite Solutions explained, with a solved SAT question →
4. Mixture Problem
Systems of two linear equations
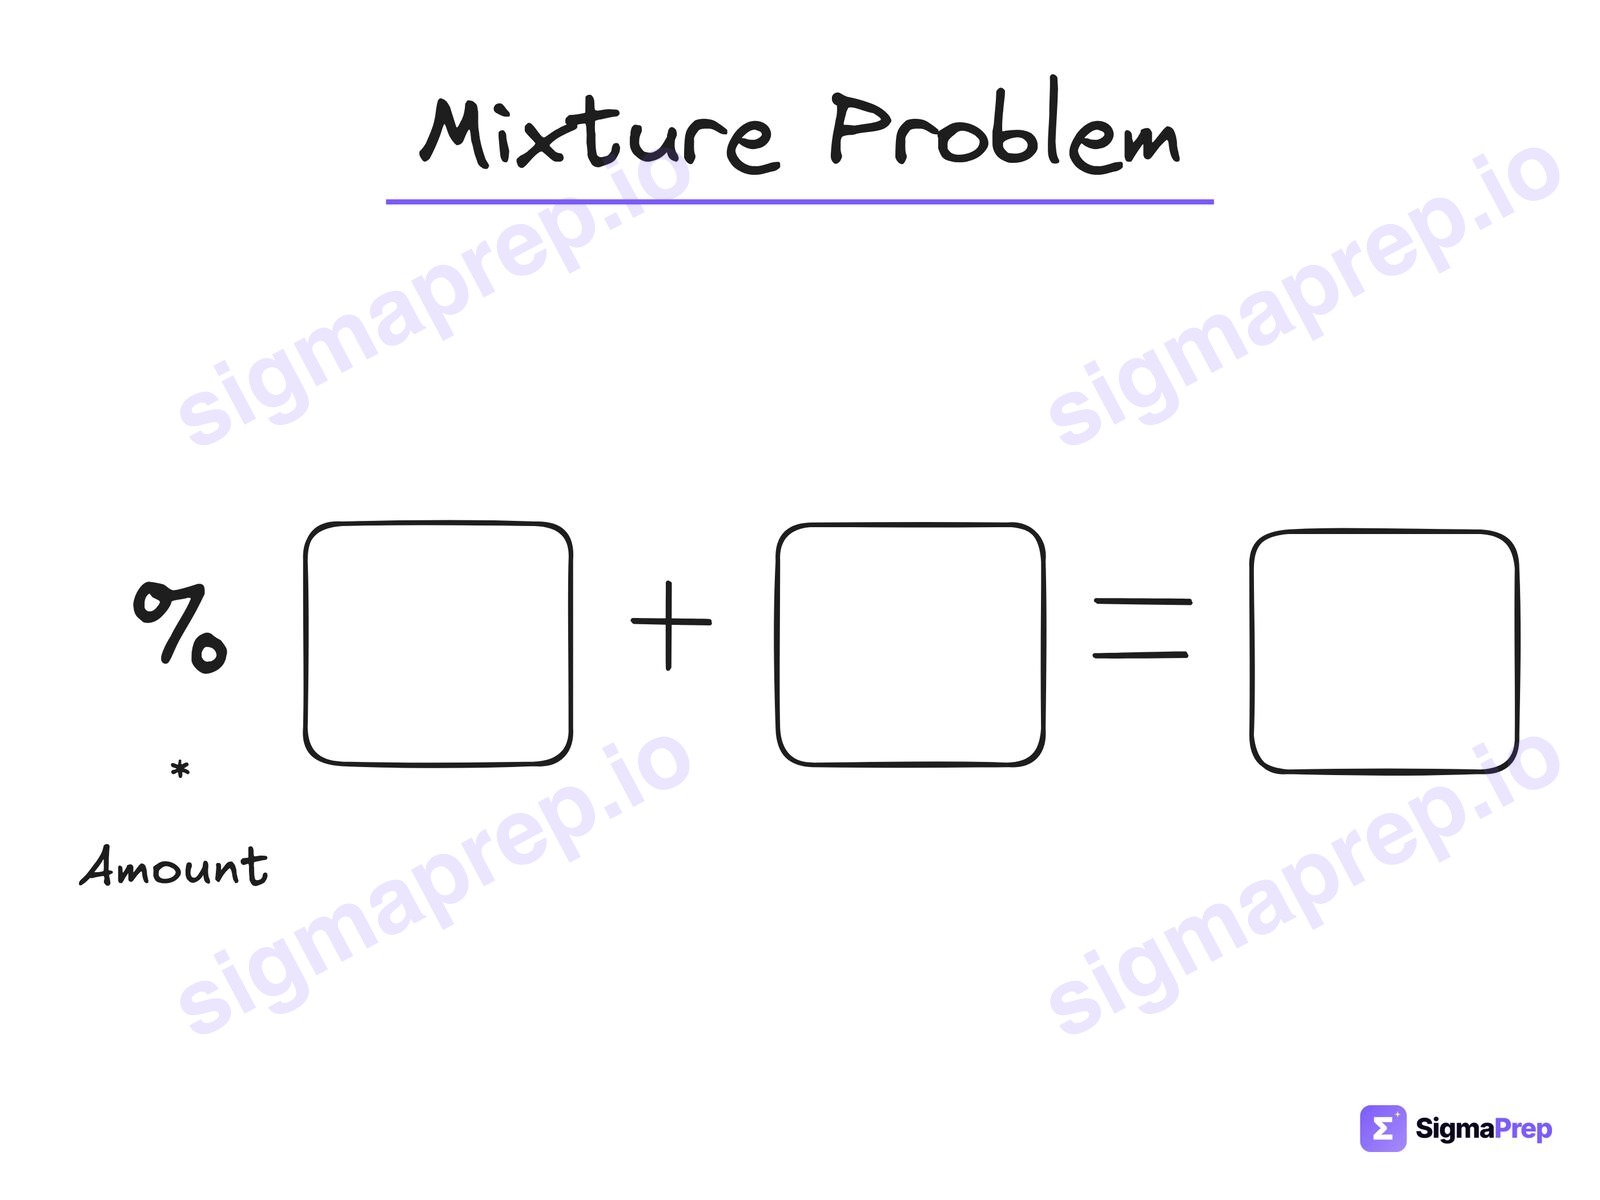
(percent × amount) + (percent × amount) = (percent × amount)If one amount is x, the other is the total minus x
Notes: Two cups going into one cup. Every cup gets a percent and an amount, and the equation is (percent)(amount) + (percent)(amount) = (percent)(amount). If one amount is x, the other one is the total minus x.
Mixture Problem explained, with a solved SAT question →
Advanced Math
About 35% of the section, and where most hard questions live: quadratics, exponentials, and rewriting expressions.
5. Exponent Rules
Equivalent expressions
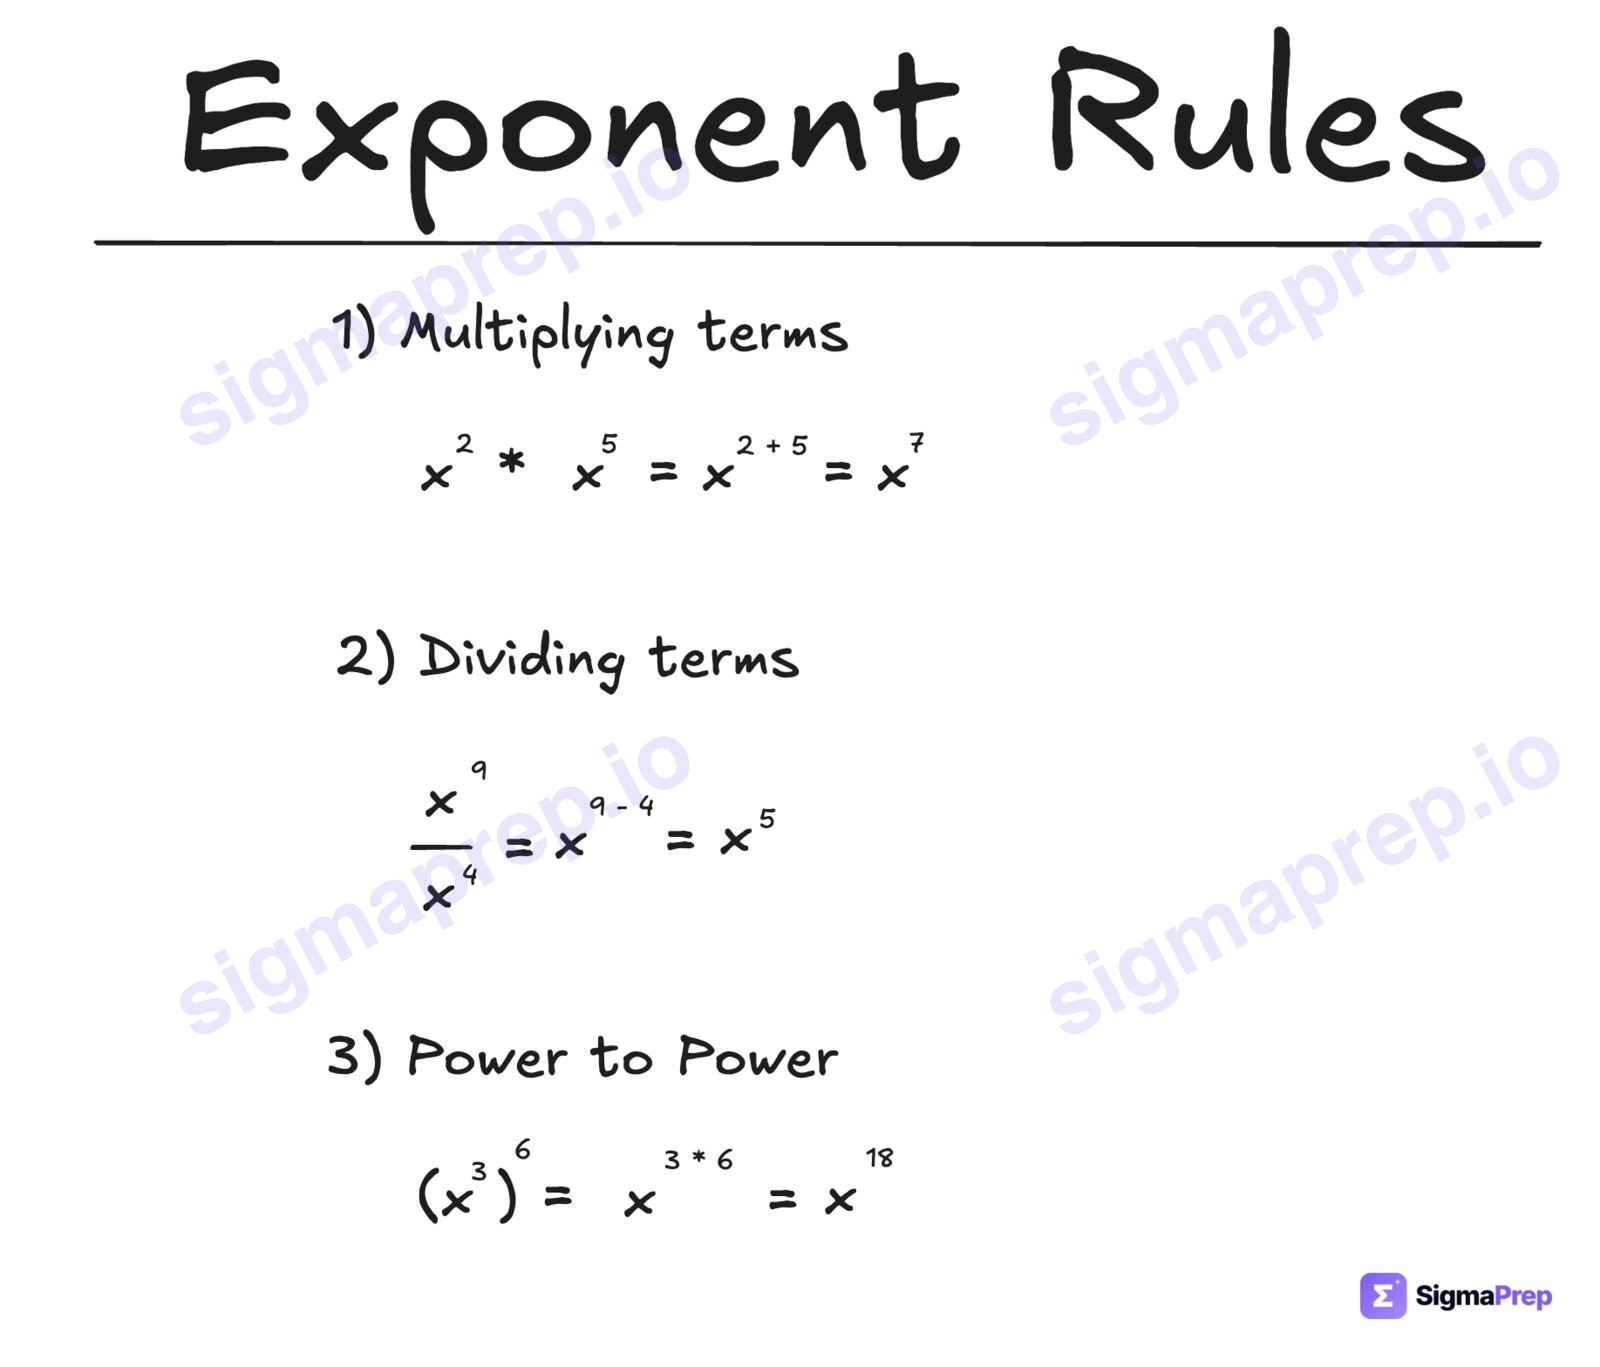
xa · xb = xa+bxa ÷ xb = xa−b(xa)b = xabMultiply adds, divide subtracts, a power of a power multiplies
Notes: Three rules, in order. Multiplying means add the exponents, dividing means subtract the exponents, and an exponent raised to another exponent means you multiply the exponents.
Exponent Rules explained, with a solved SAT question →
6. Exponential to Radical
Equivalent expressions
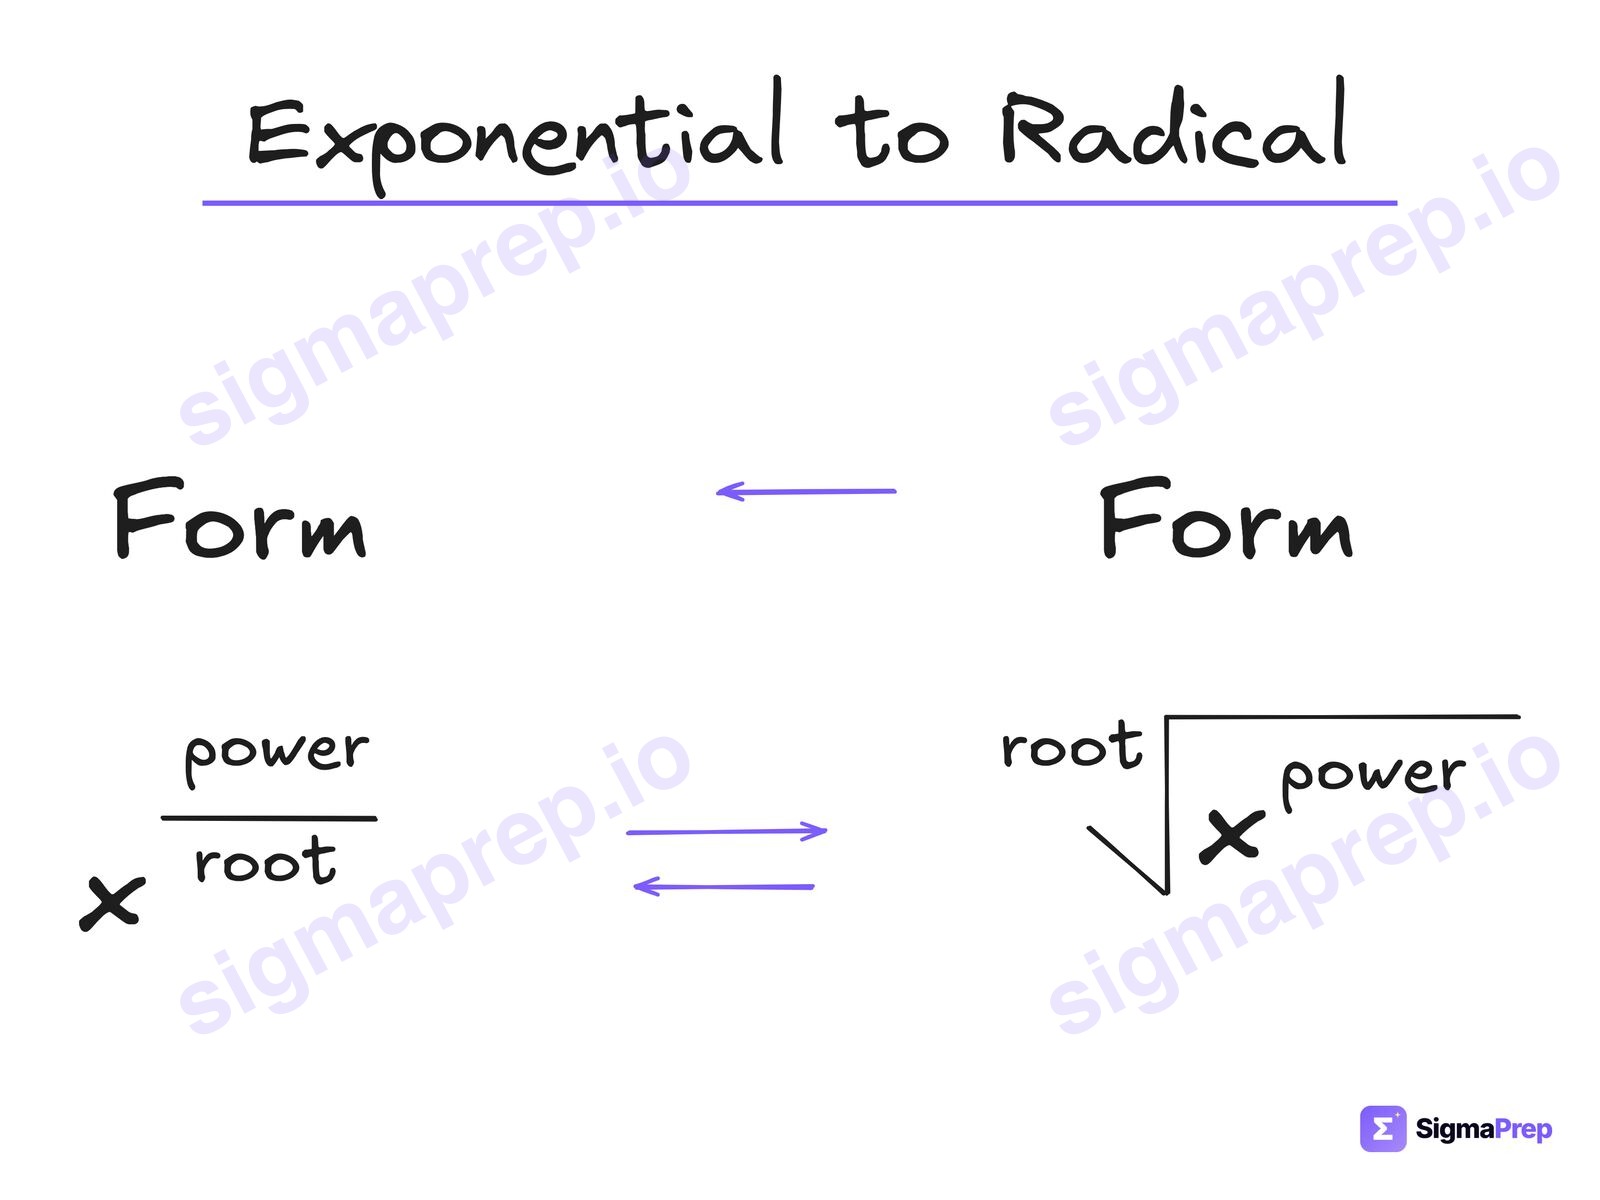
xpower/root = root√(xpower)Power on top, root on the bottom
Notes: Never leave a radical as a radical. Root on the outside, power on the inside, and as an exponent you write power divided by root. Also remember that a square root has a root of 2 even though nobody writes a 2 on the outside.
Exponential to Radical explained, with a solved SAT question →
7. Factoring
Equivalent expressions
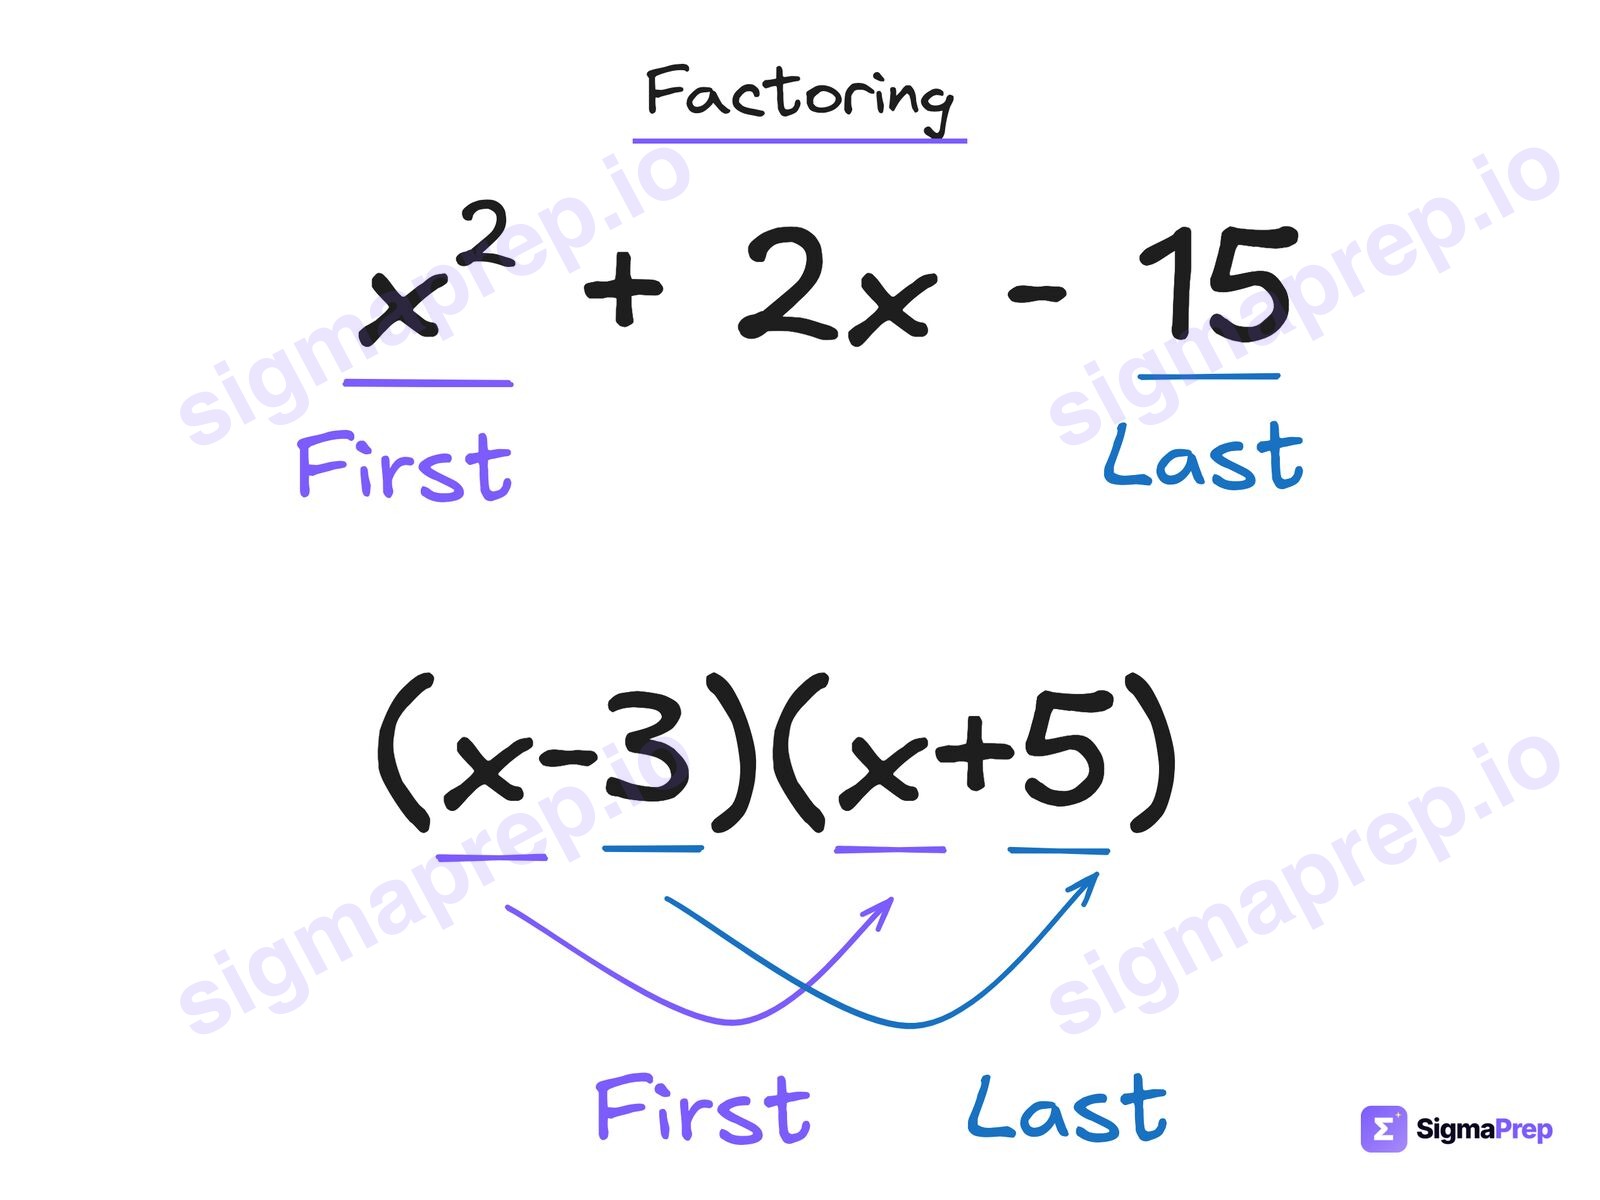
x² + 2x − 15 = (x − 3)(x + 5)First times first, last times last
Notes: When comparing factored form to expanded form, notice that in FOIL first times first gives the first term in expanded form, and last times last gives the last term.
Factoring explained, with a solved SAT question →
8. Quadratics
Nonlinear functions
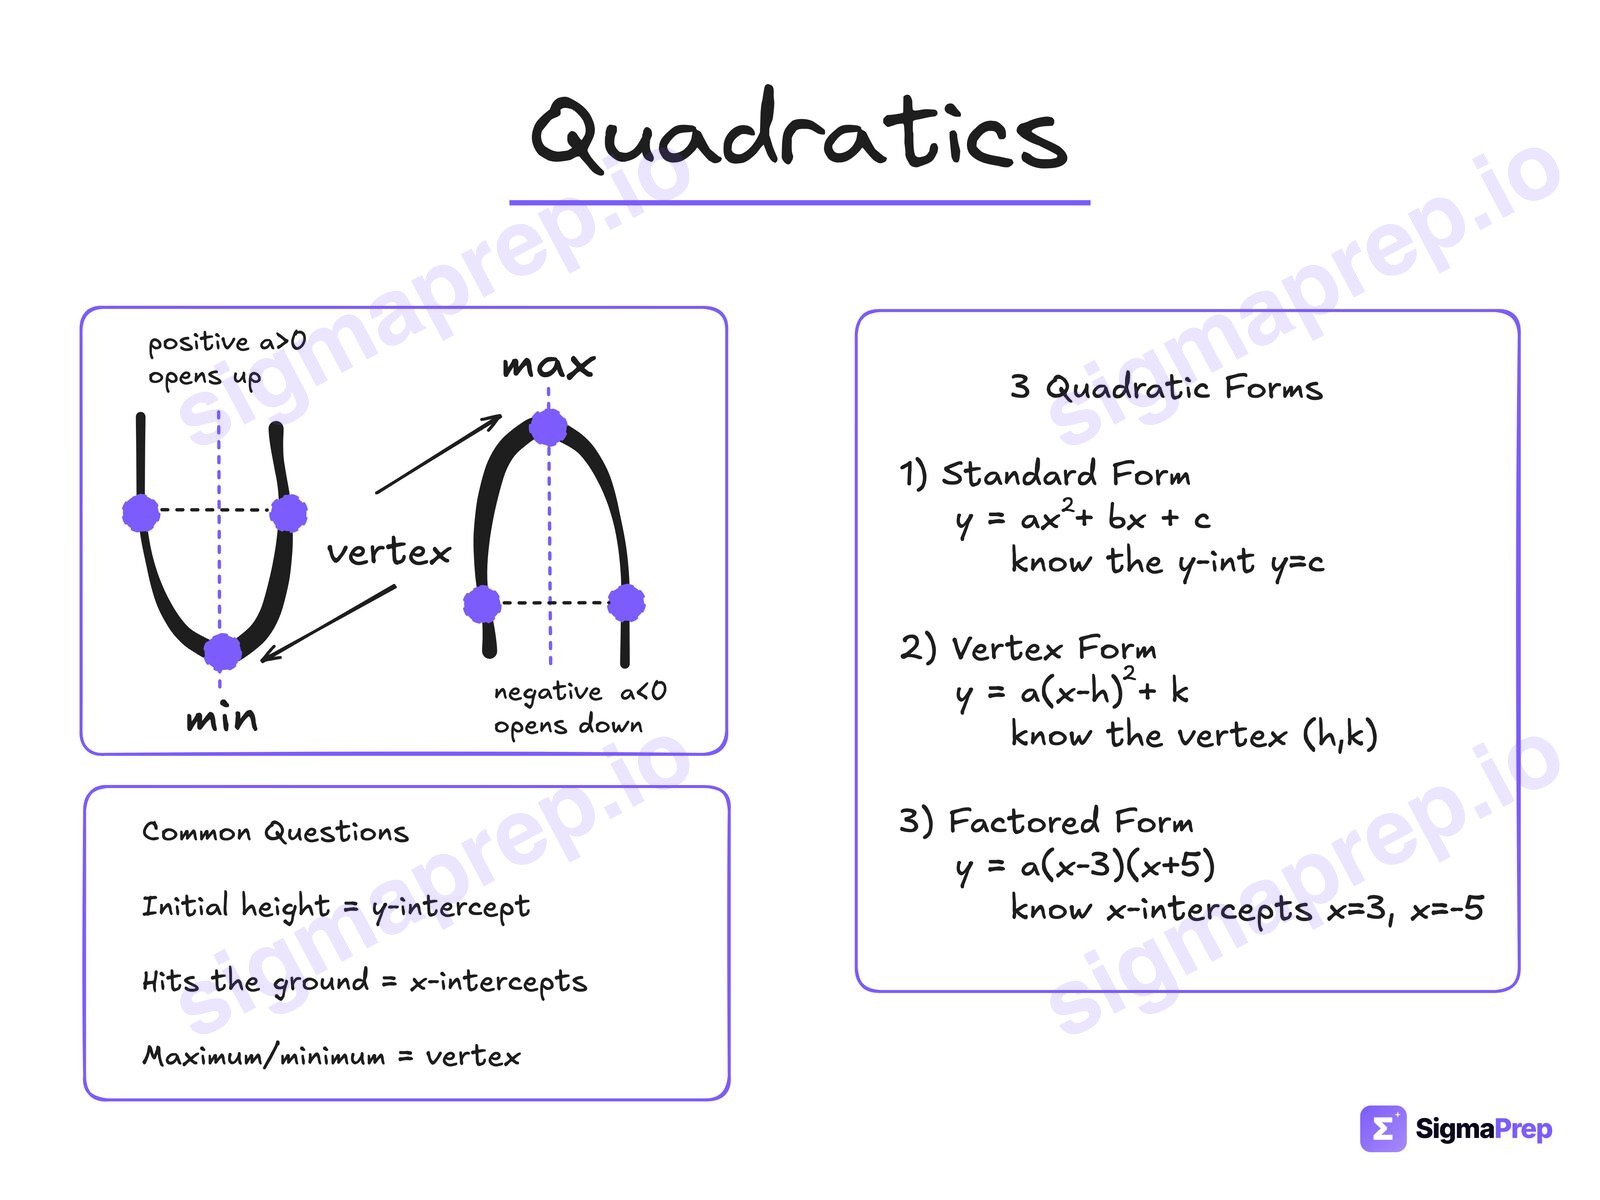
standard: y = ax² + bx + cvertex: y = a(x − h)² + kfactored: y = a(x − r₁)(x − r₂)Each form hands you one thing: the y-intercept, the vertex, the roots
Notes: Know the 3 quadratic forms and what information each one gives you. Know the common questions and what they represent in context. Understand symmetry through the vertex of a quadratic.
Quadratics explained, with a solved SAT question →
9. Quadratic Interpretations
Nonlinear functions
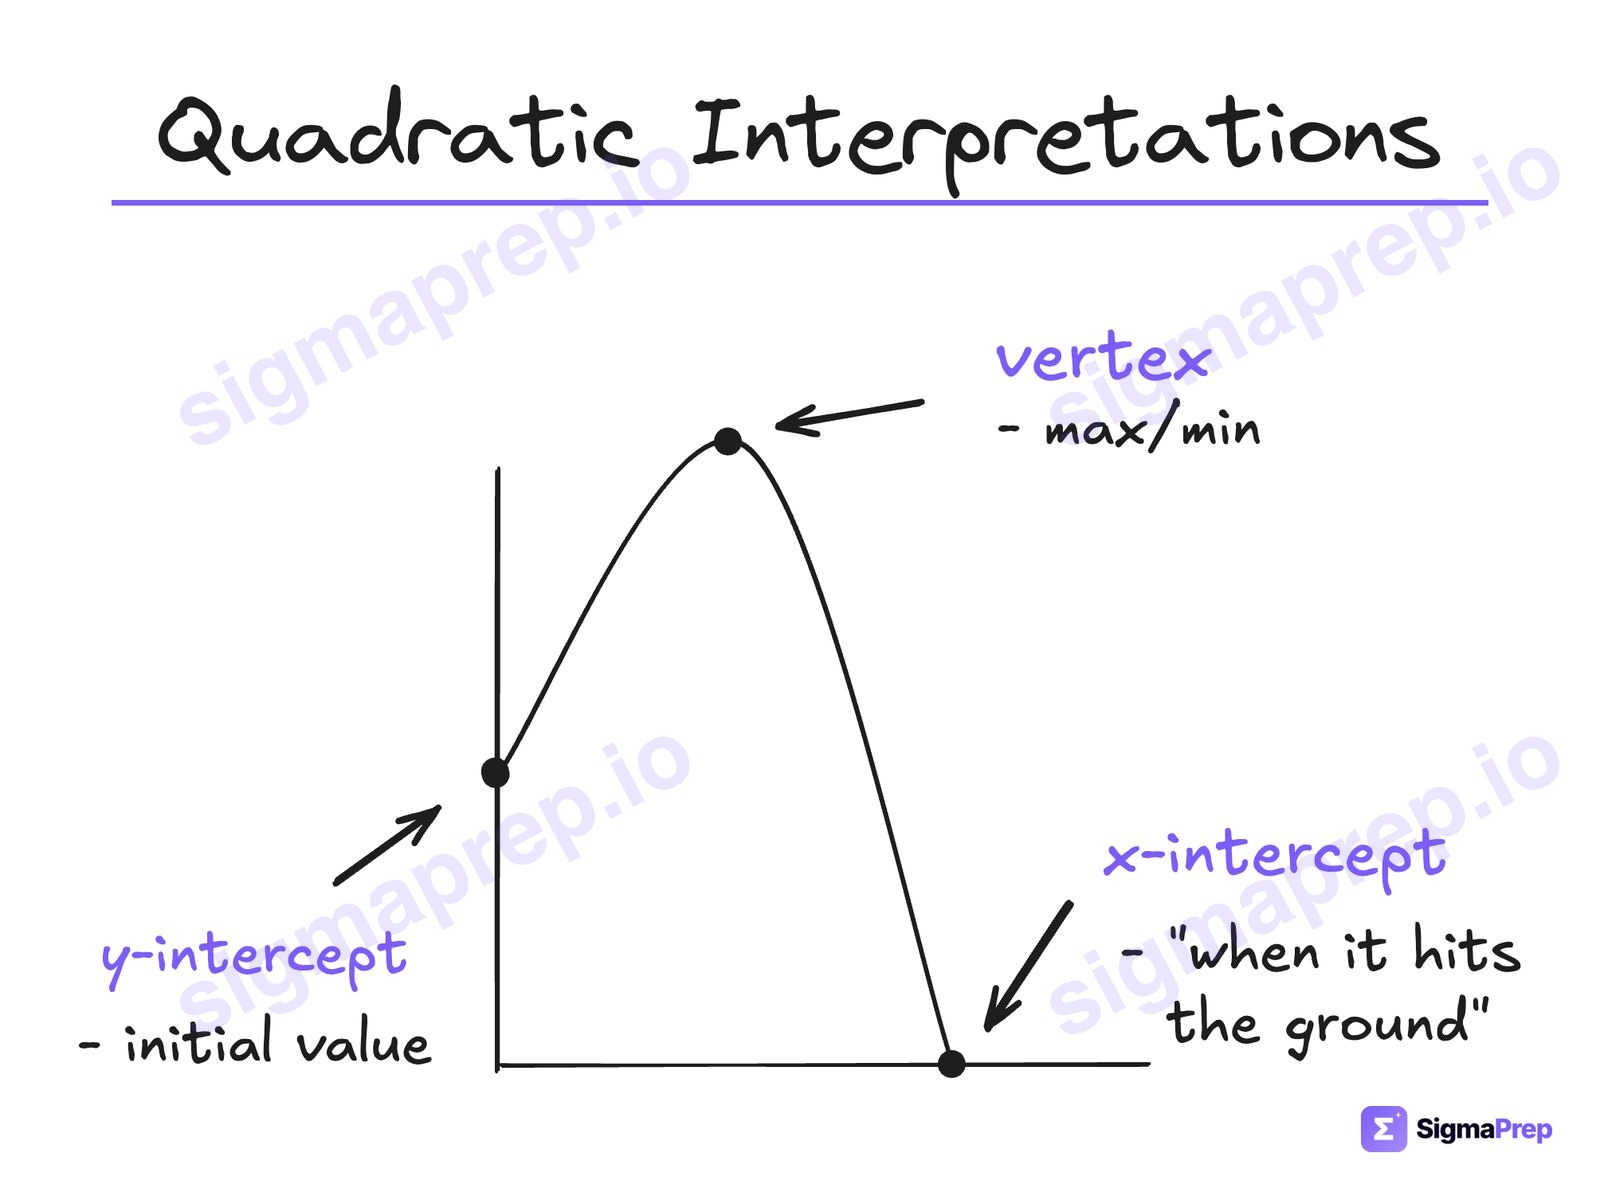
Notes: Three points they ask about: the y-intercept is the "starting value," the x-intercept is when it "hits the ground," the vertex is the "max or min." Those are the kinds of words to listen for; they are not always word for word.
Quadratic Interpretations explained, with a solved SAT question →
10. Discriminant
Nonlinear equations in one variable and systems of equations in two variables
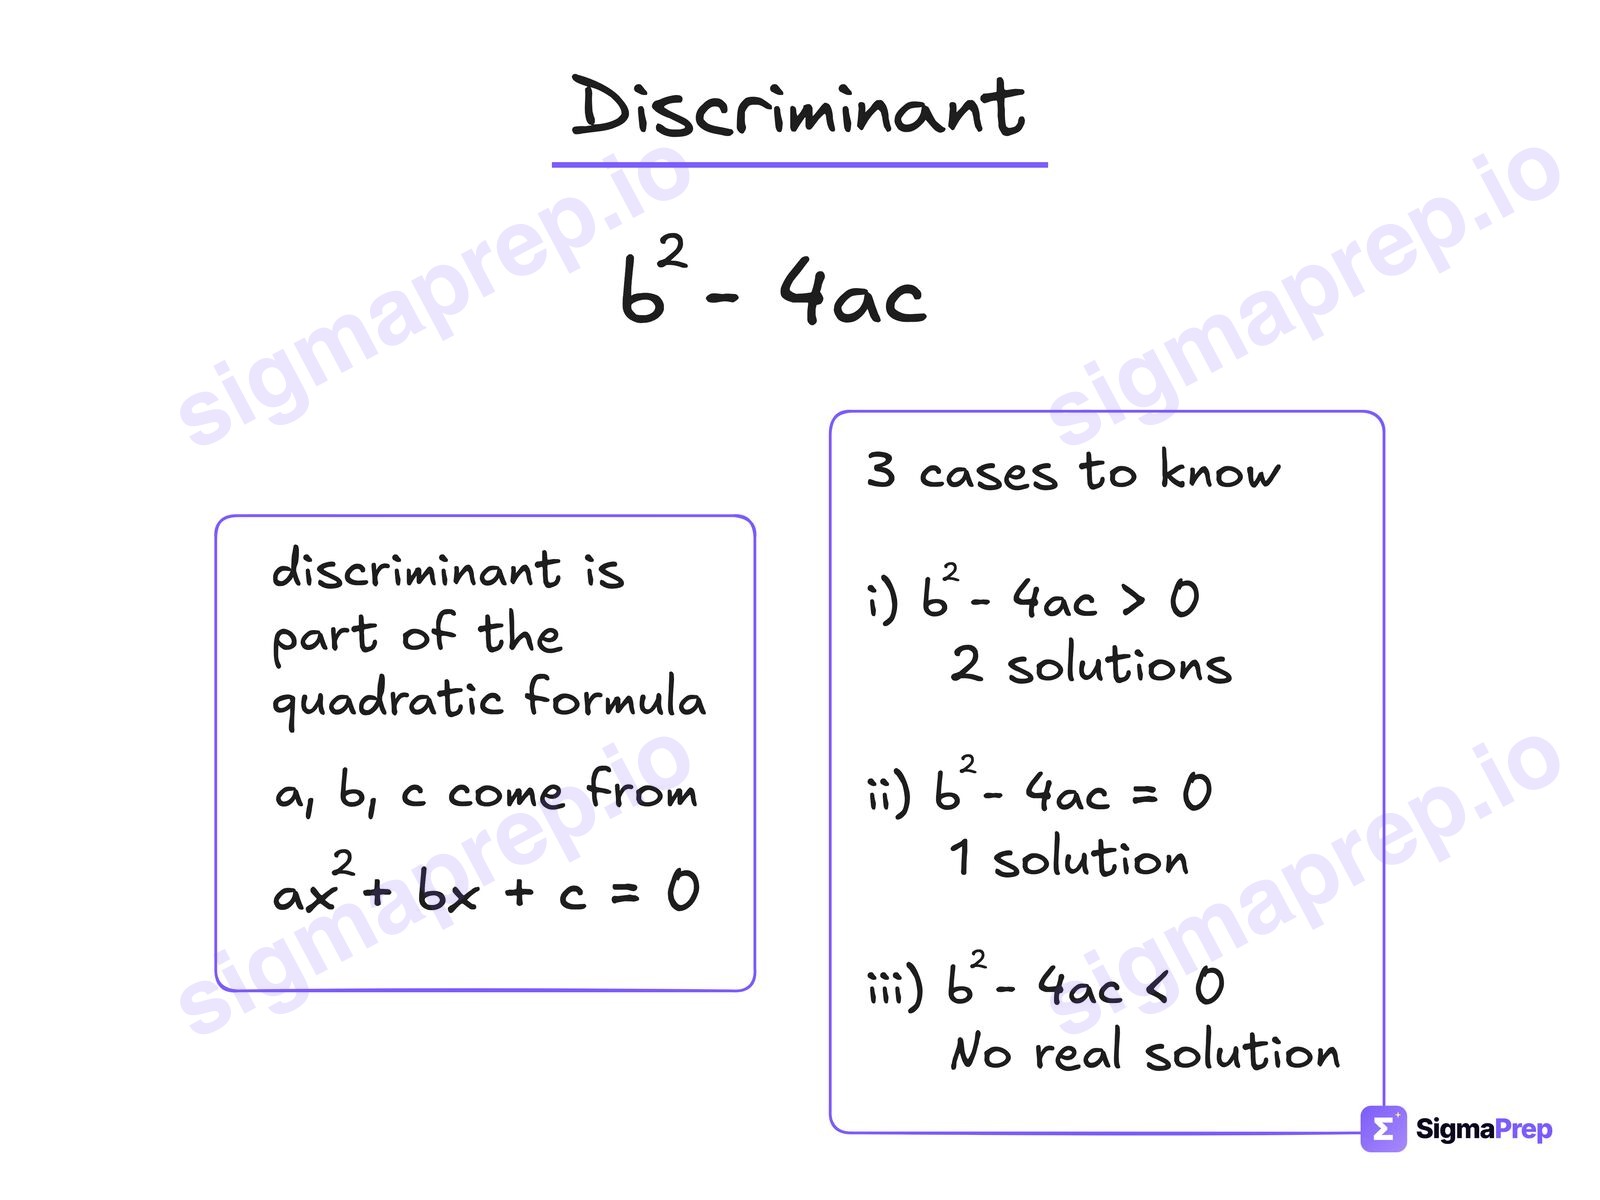
b² − 4ac > 0 → 2 solutionsb² − 4ac = 0 → 1 solutionb² − 4ac < 0 → no real solutiona, b and c come from ax² + bx + c = 0
Notes: Two things to spot: you need a quadratic, and a sentence telling you how many solutions. That is a discriminant problem. Know the 3 cases: greater than 0 for 2 solutions, equal to 0 for 1 solution, and less than 0 for no solution. Then let Desmos solve it.
Discriminant explained, with a solved SAT question →
11. Exponential Equation
Nonlinear functions
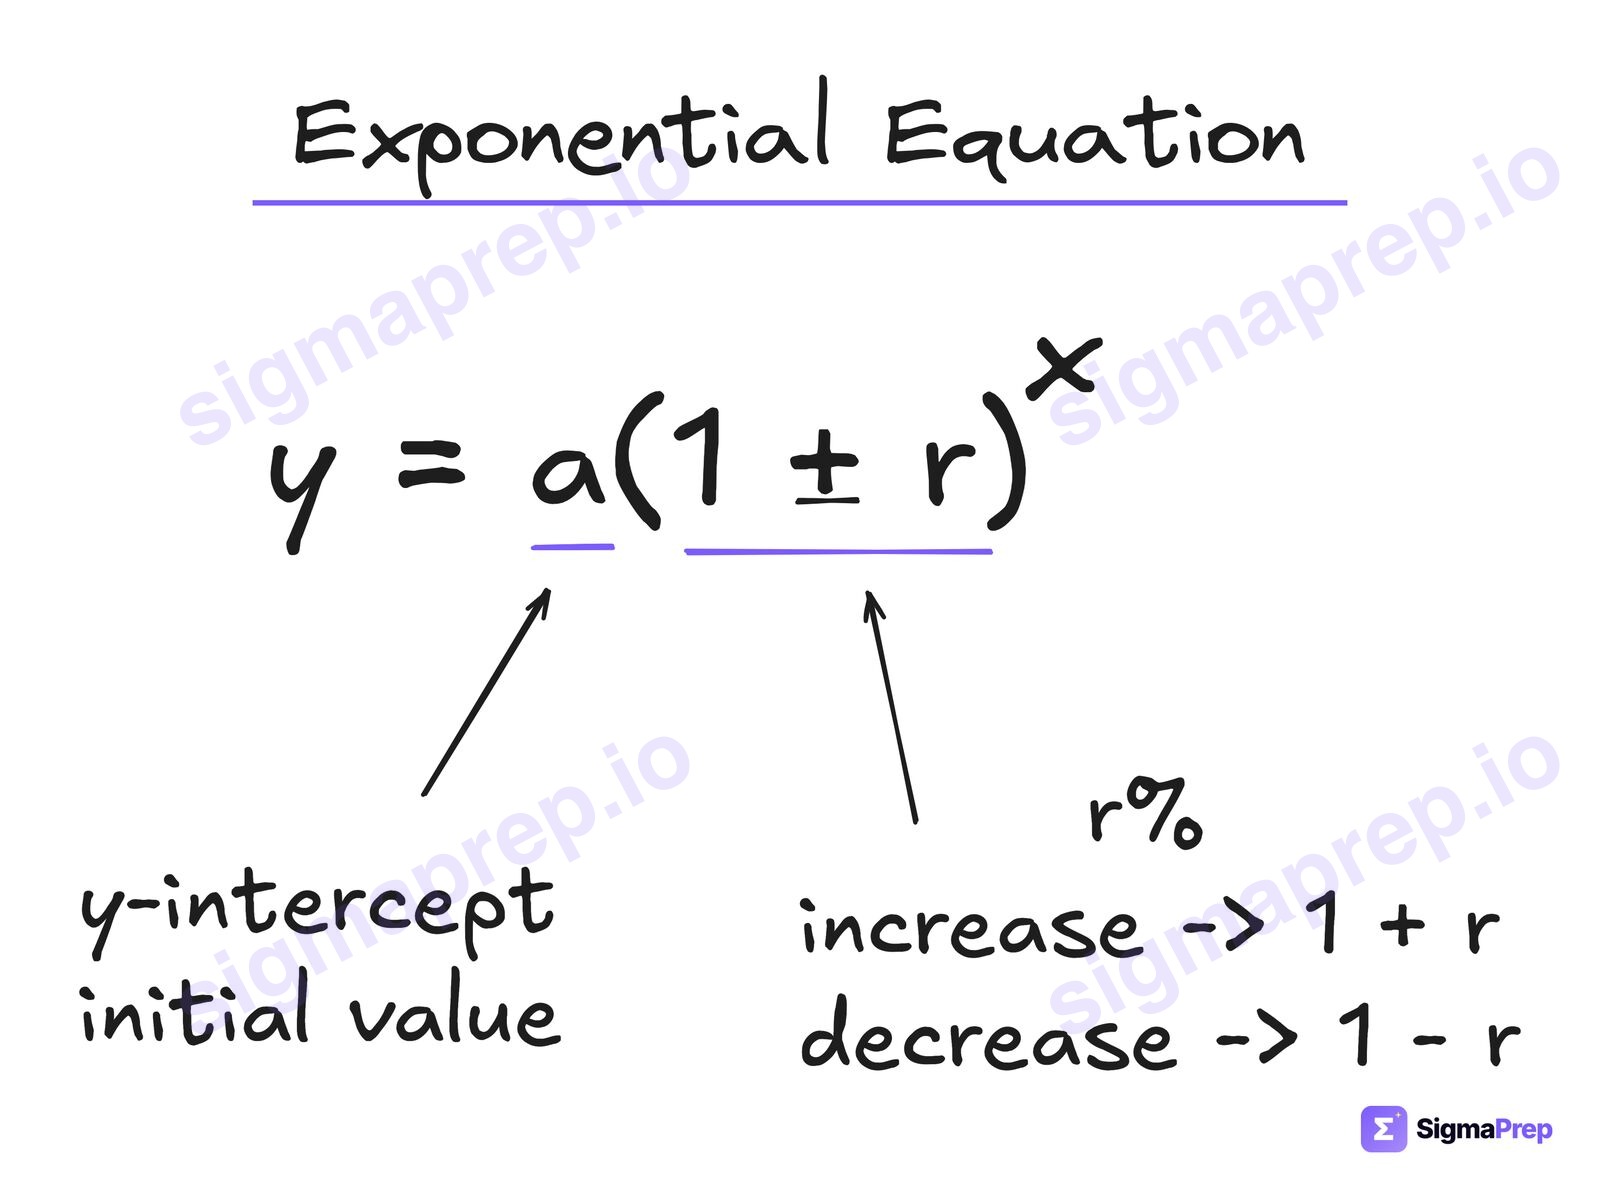
y = a(1 ± r)xa is the initial value, r the rate as a decimal
Notes: Two things to know: the number in front is the initial value, and the number inside the parentheses, with the exponent, represents the increase or decrease (usually in terms of percent).
Exponential Equation explained, with a solved SAT question →
12. Transformations
Nonlinear functions
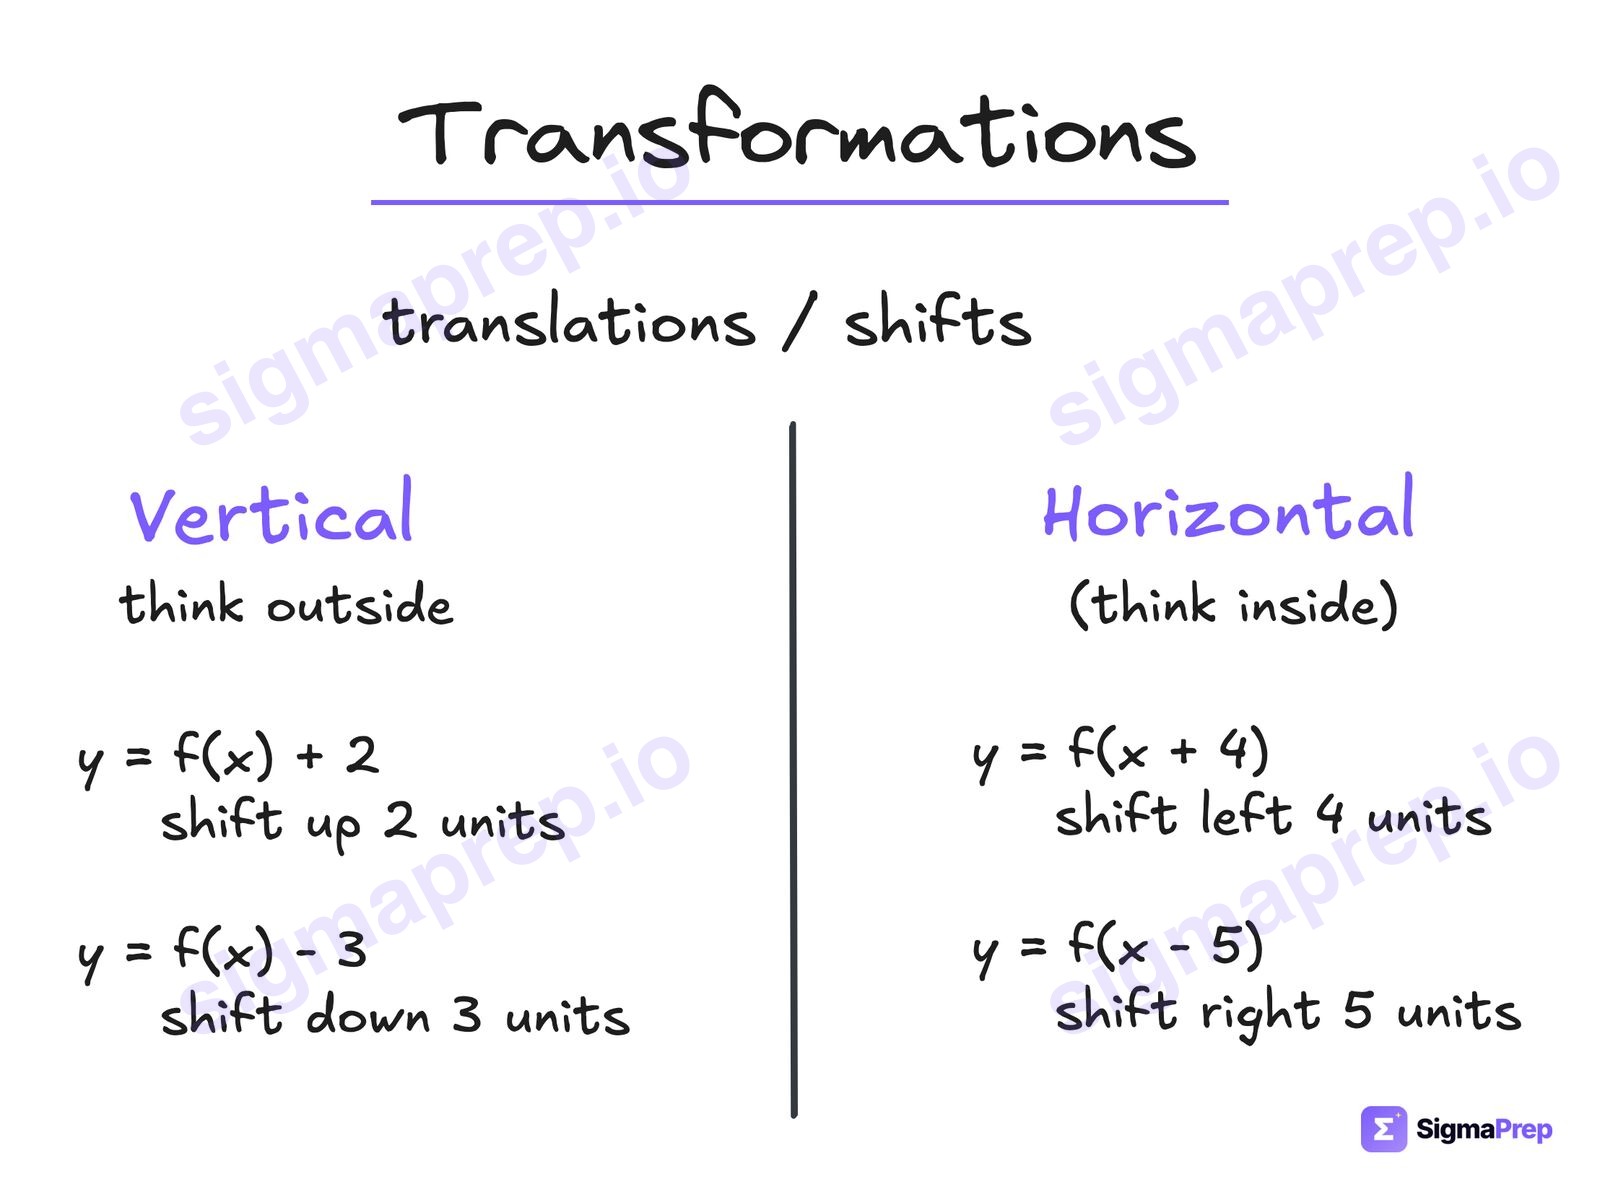
f(x) + k → up kf(x − h) → right hOutside is vertical, inside is horizontal and reversed
Notes: They only really test you on shifts. Vertical, think outside. Horizontal, think inside. Vertical is intuitive: f(x) + 5 means up 5. Horizontal is counterintuitive: f(x + 5) means left 5, not right 5.
Transformations explained, with a solved SAT question →
Problem-Solving and Data Analysis
About 15%. Percents, units, and reading data. The formulas are simple; the setups are where points are lost.
13. Unit Conversions
Ratios, rates, proportional relationships, and units
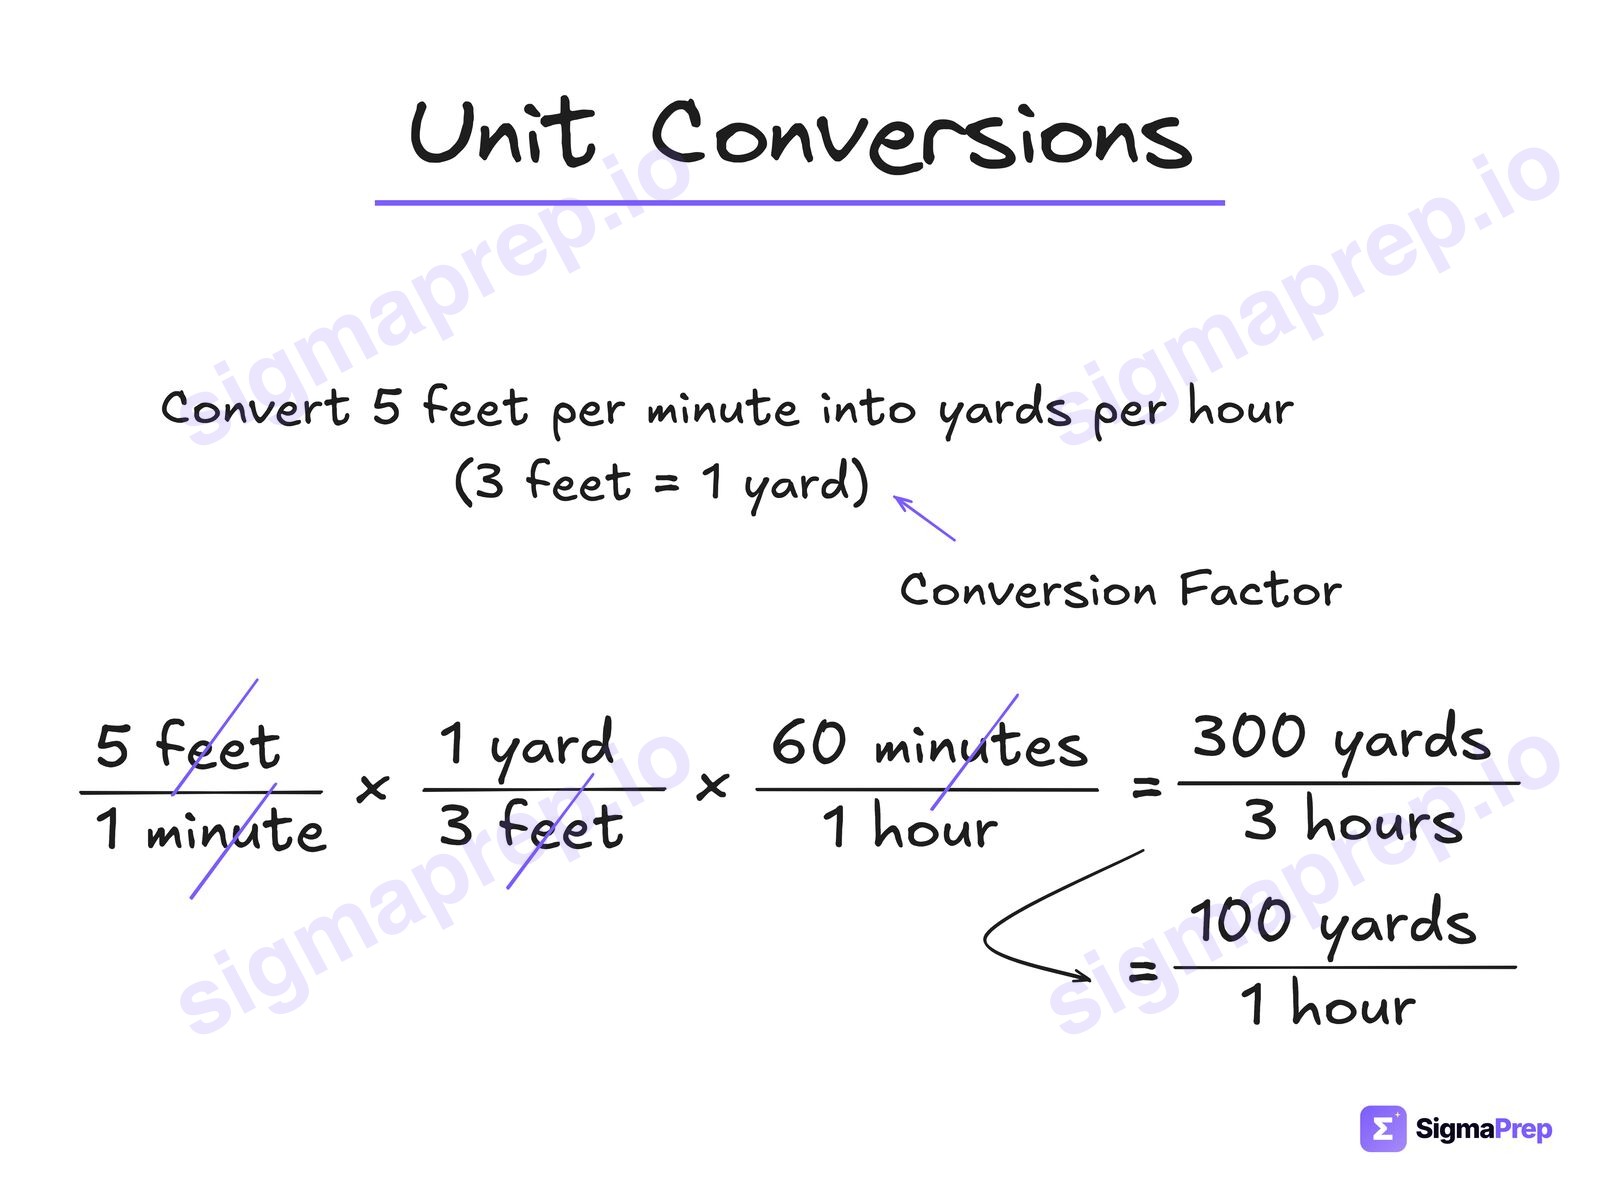
5 ft/min × (1 yd / 3 ft) × (60 min / 1 hr) = 100 yd/hrLine the units up so each one cancels
Notes: Per makes the fraction. Line the units up so each one cancels: whatever is on the bottom of one fraction goes on top of the next. If a unit is squared, square the whole conversion factor, or the units will not cancel.
Unit Conversions explained, with a solved SAT question →
14. Percent Change
Percentages
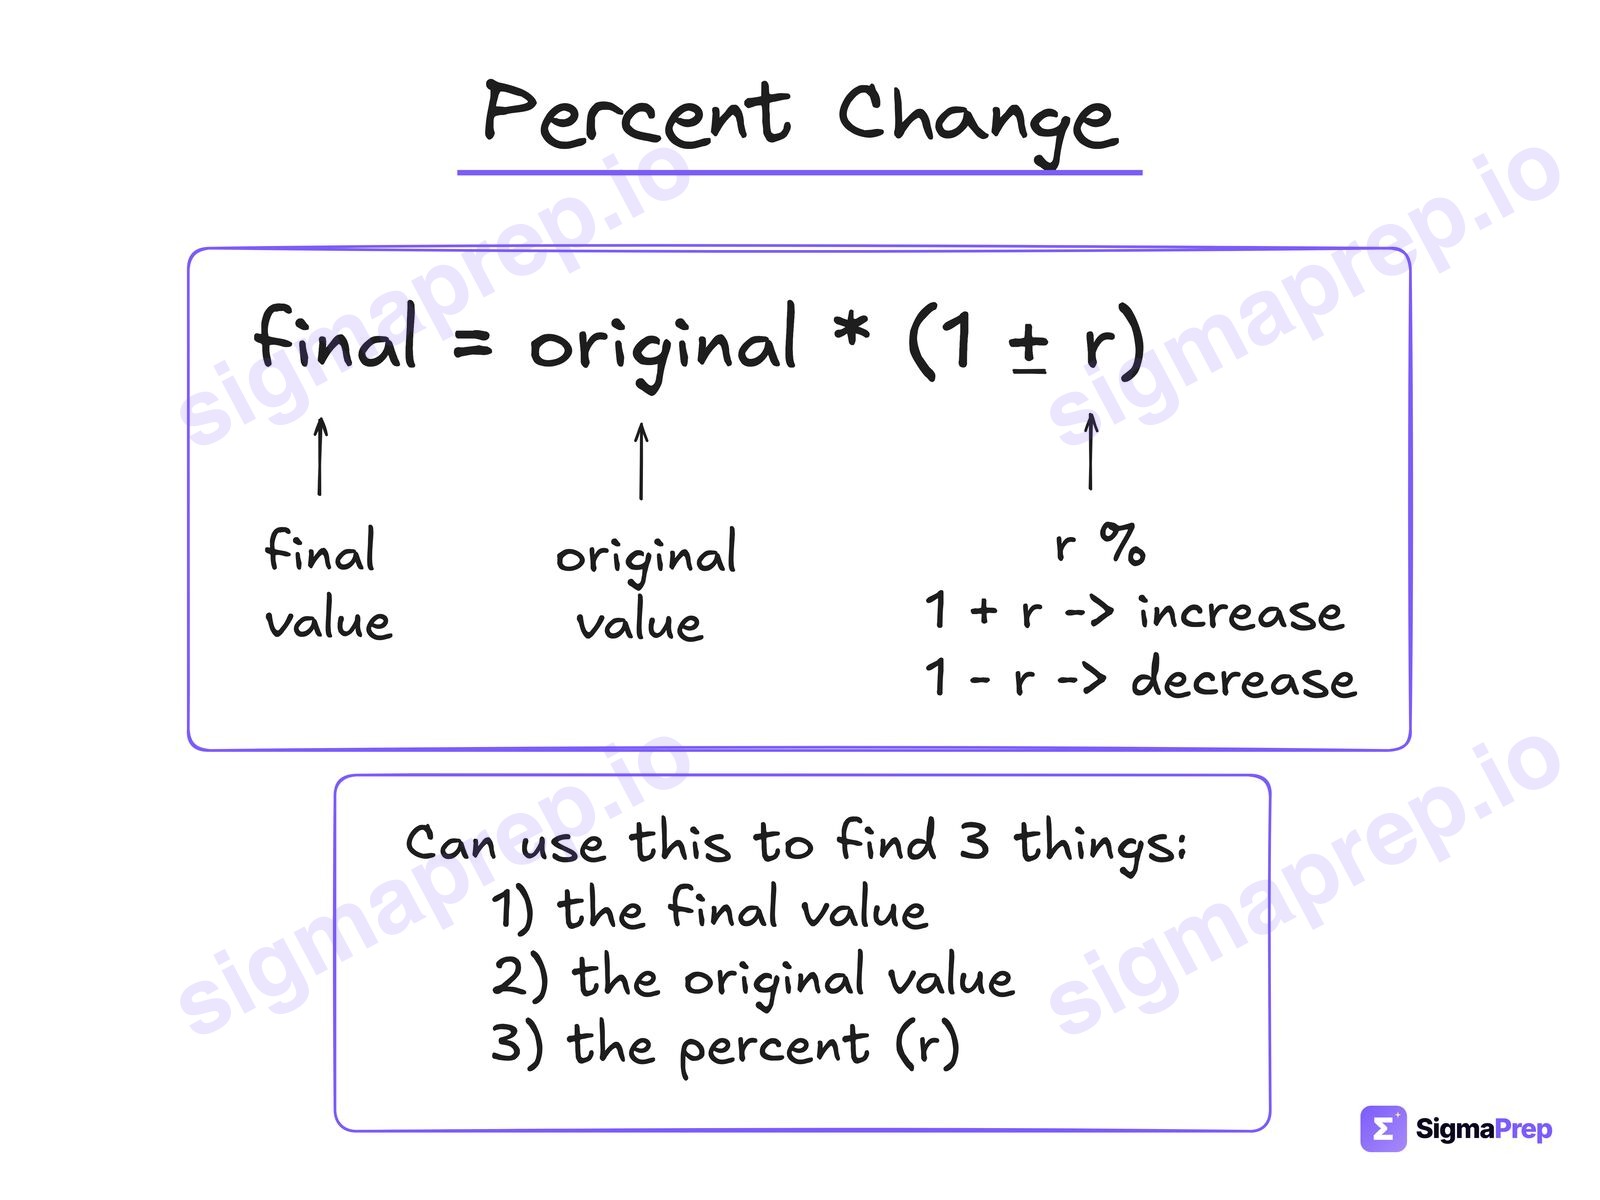
final = original × (1 ± r)Solve for whichever of the three the question asks for
Notes: Use this equation in 3 different ways: to find the final amount, the original amount, or the percent. Make whatever the question asks for the unknown, x, plug in numbers for the other two, and let Desmos solve it for you. Very useful and versatile.
Percent Change explained, with a solved SAT question →
15. Statistics
One-variable data: distributions and measures of center and spread
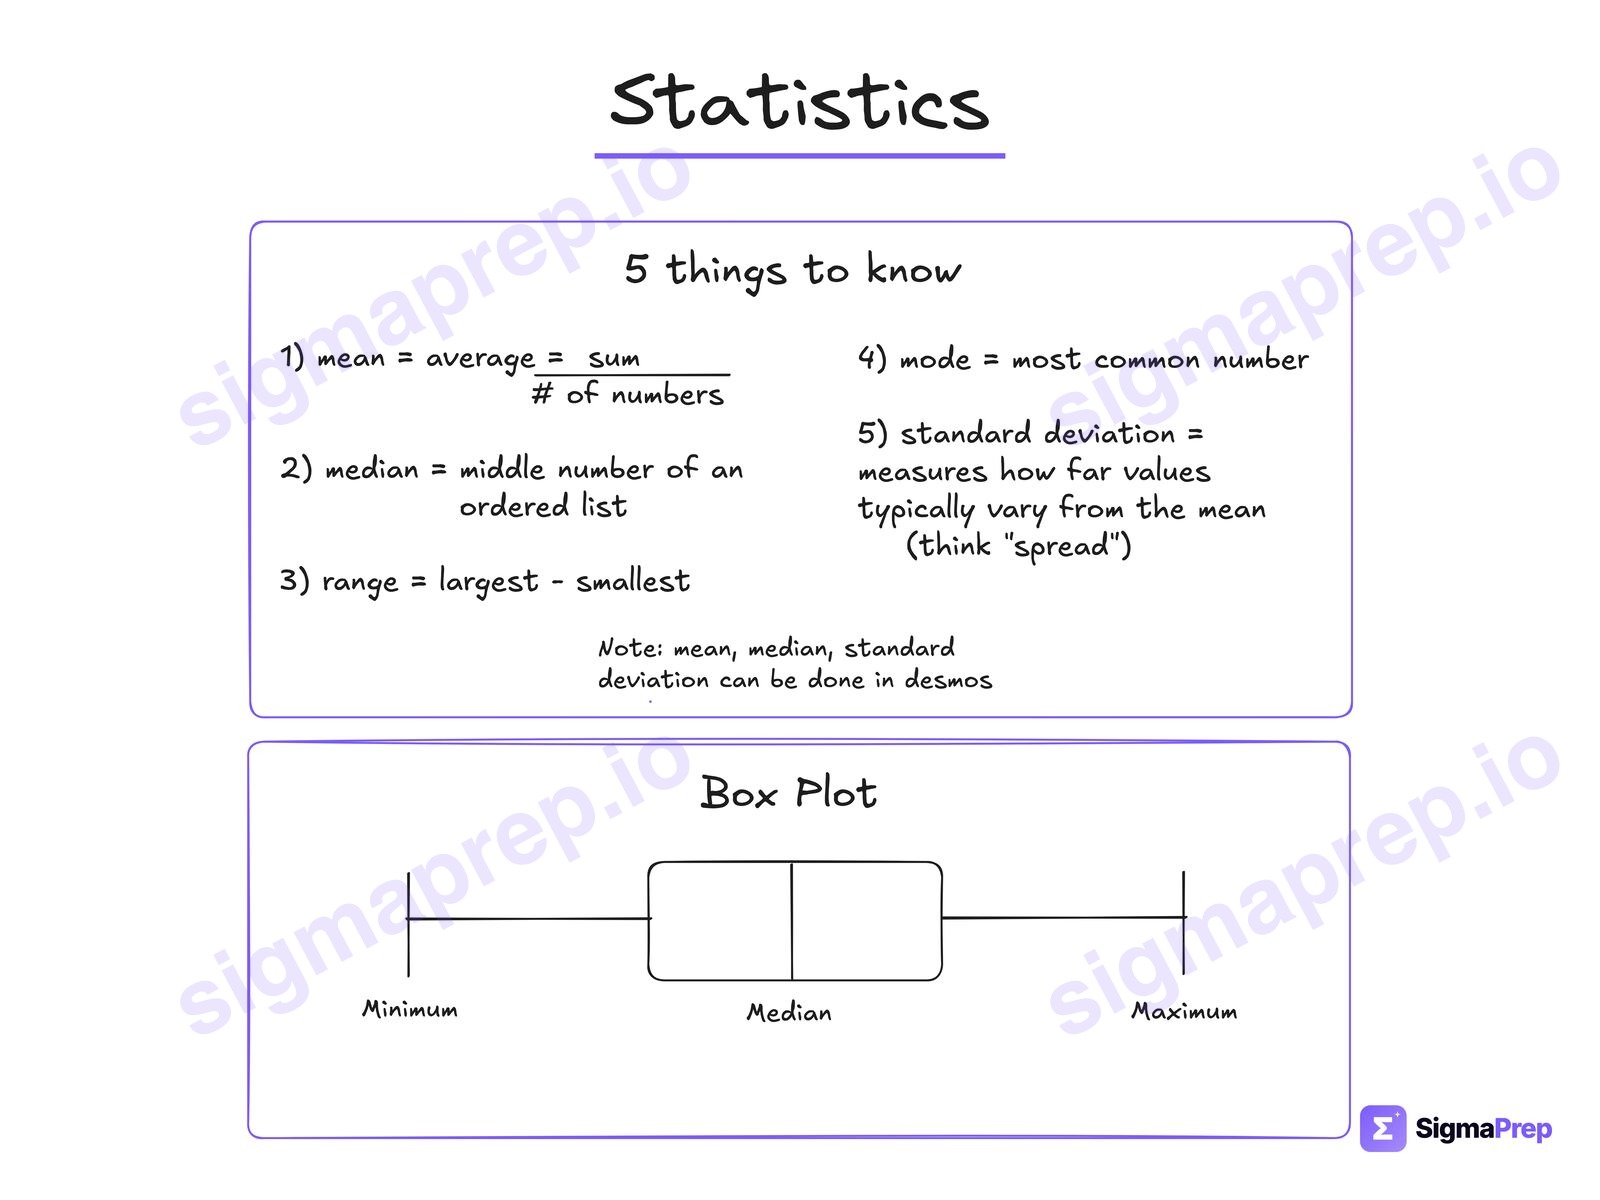
mean = sum ÷ countmedian = middle number of an ordered listrange = largest − smallestmode = most common numberstandard deviation = spread from the meanMean, median and standard deviation can be done in Desmos. Range and mode cannot.
Notes: Know these 5 calculations for statistics. Mean, median, and standard deviation can be computed in Desmos. Range and mode MUST be memorized, because Desmos will not do them for you.
Statistics explained, with a solved SAT question →
16. Standard Deviation
One-variable data: distributions and measures of center and spread
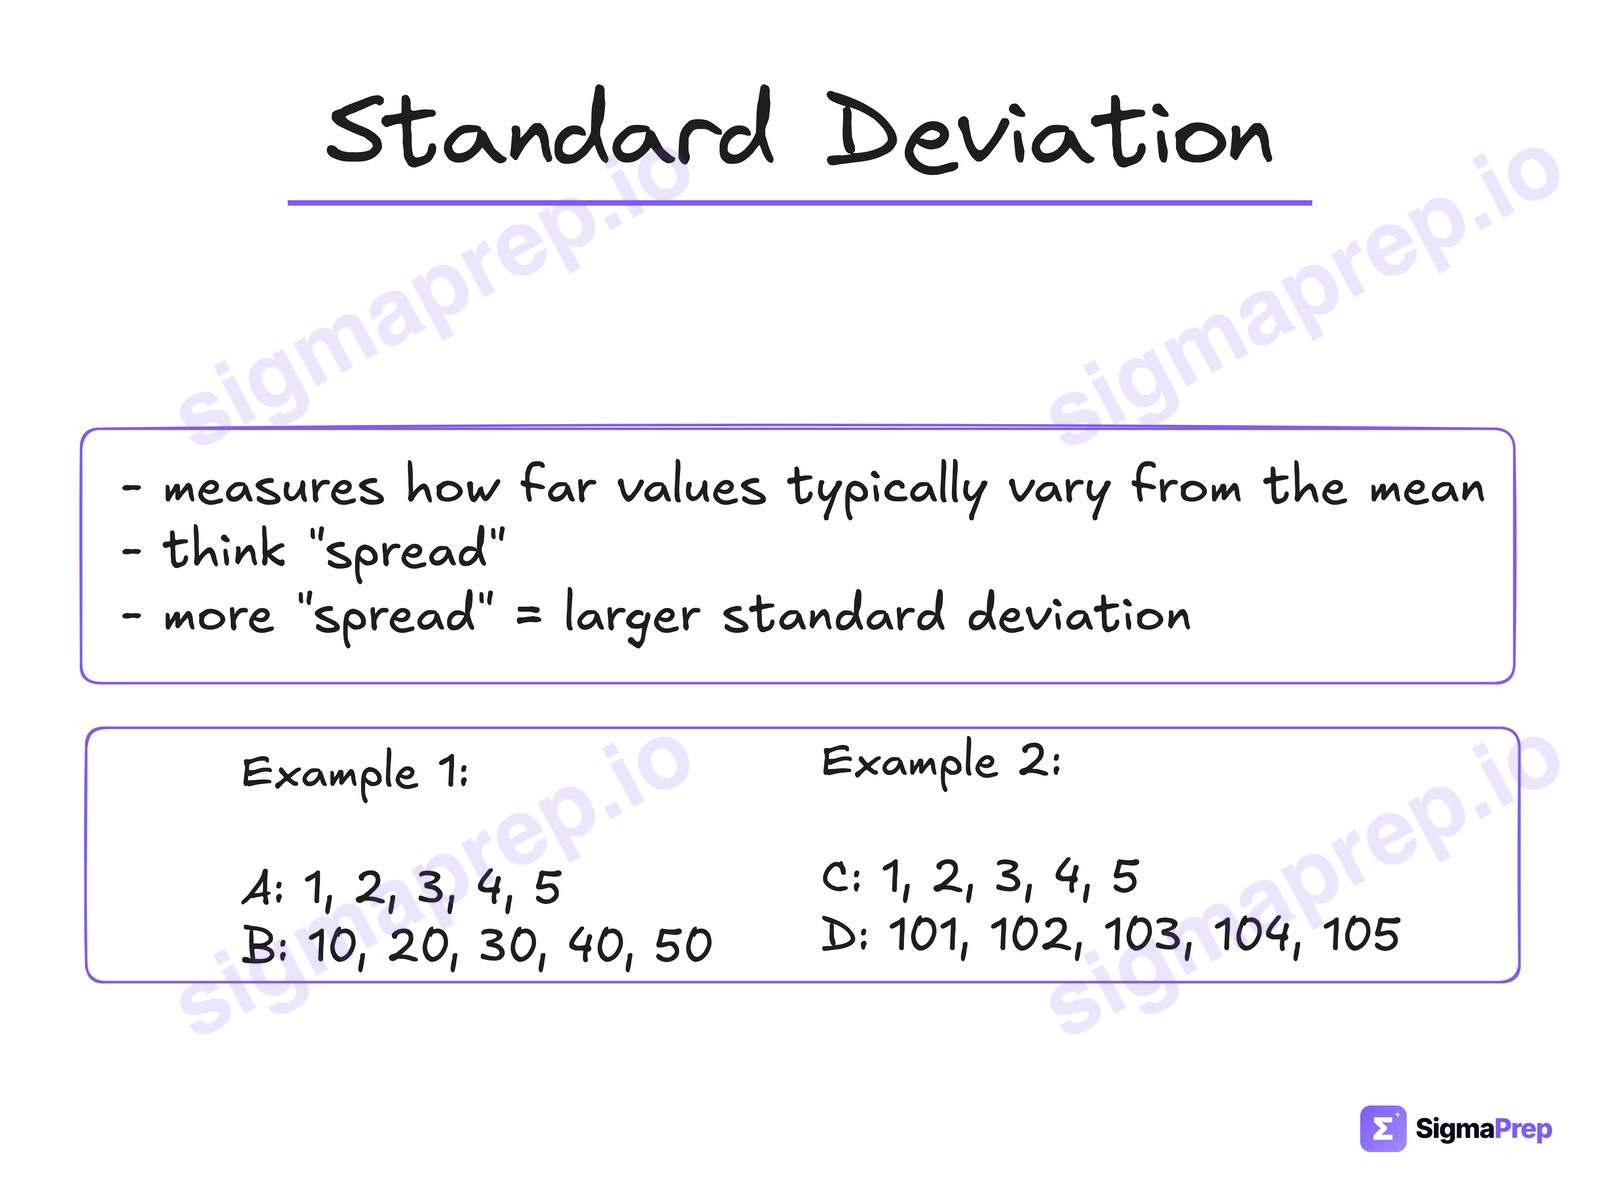
Notes: For standard deviation, simply think of spread. Just remember that one word. In the examples above, B has more spread than A, so B has the larger standard deviation. C and D always go up by 1, so their spreads are the same.
Standard Deviation explained, with a solved SAT question →
17. Probability
Probability and conditional probability
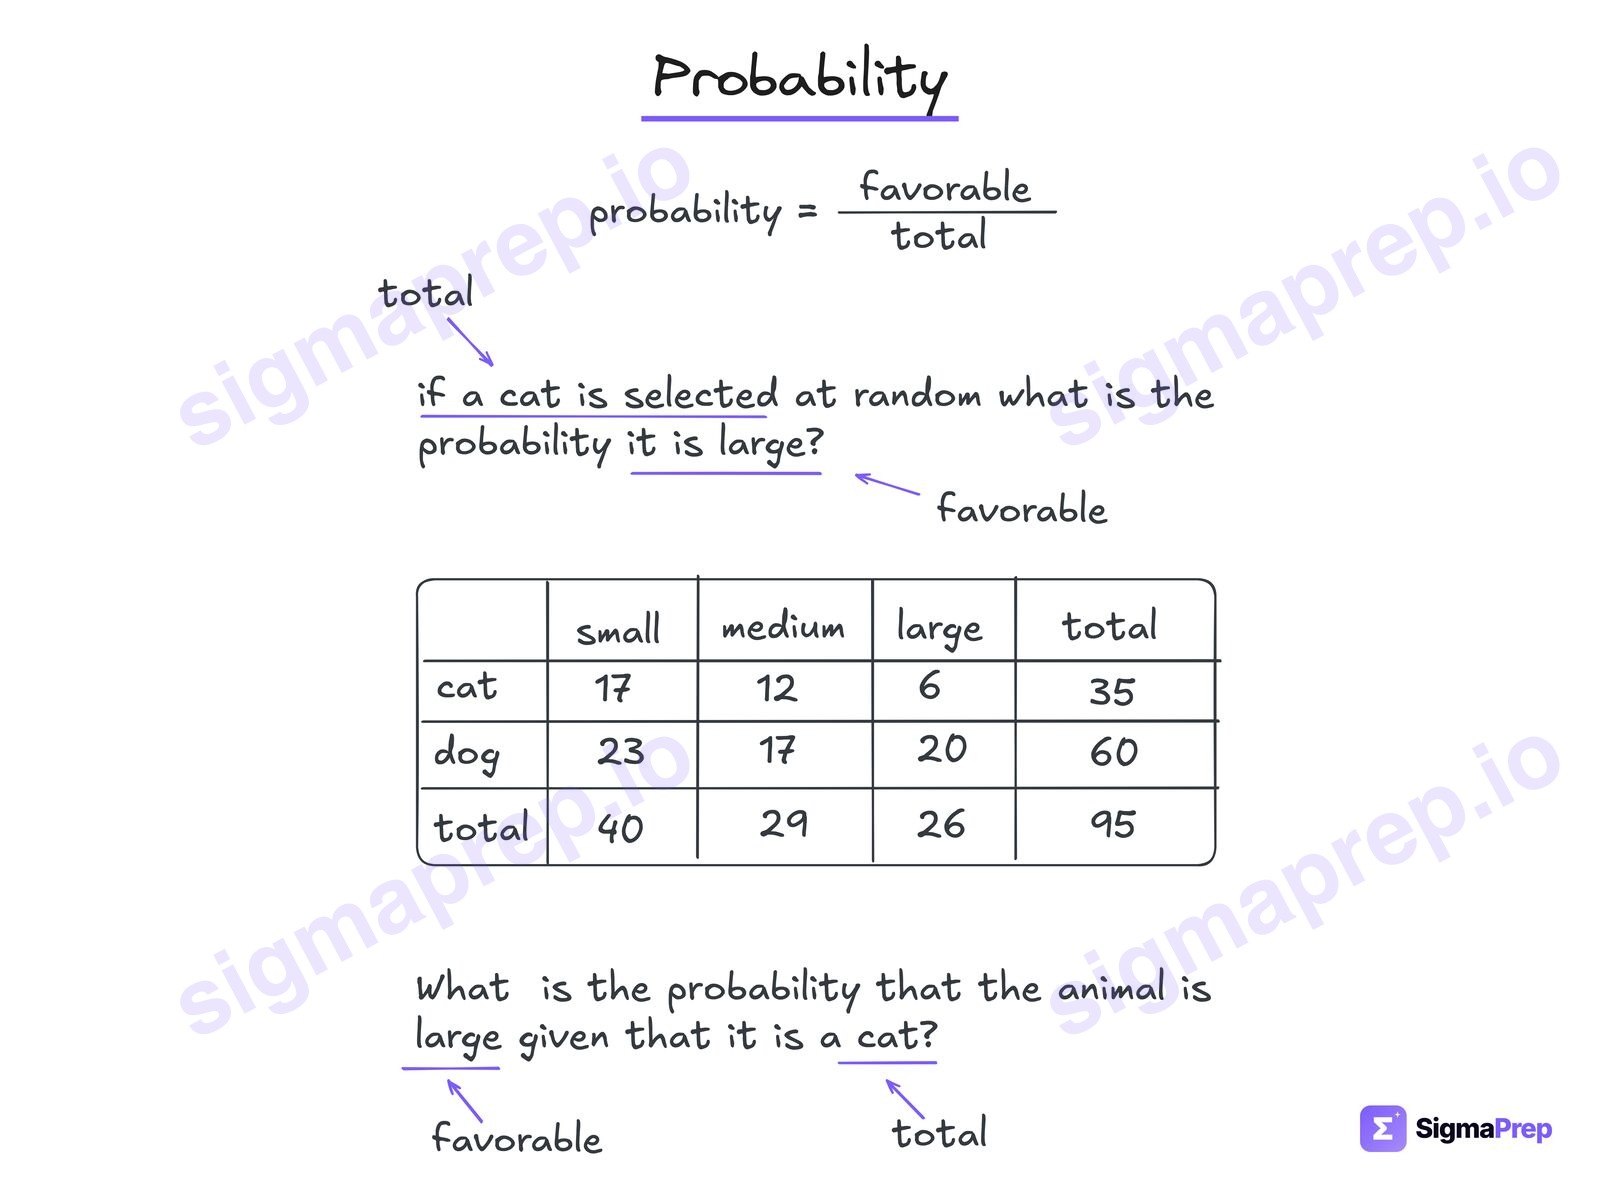
probability = favorable / totalThe words "given that" narrow the total
Notes: Probability just wants you to create a fraction. When you read these problems you need to know what the denominator is (the total) and what the numerator is (the favorable). The phrase "given that" swaps the total around.
Probability explained, with a solved SAT question →
18. Statistical Inference
Inference from sample statistics and margin of error
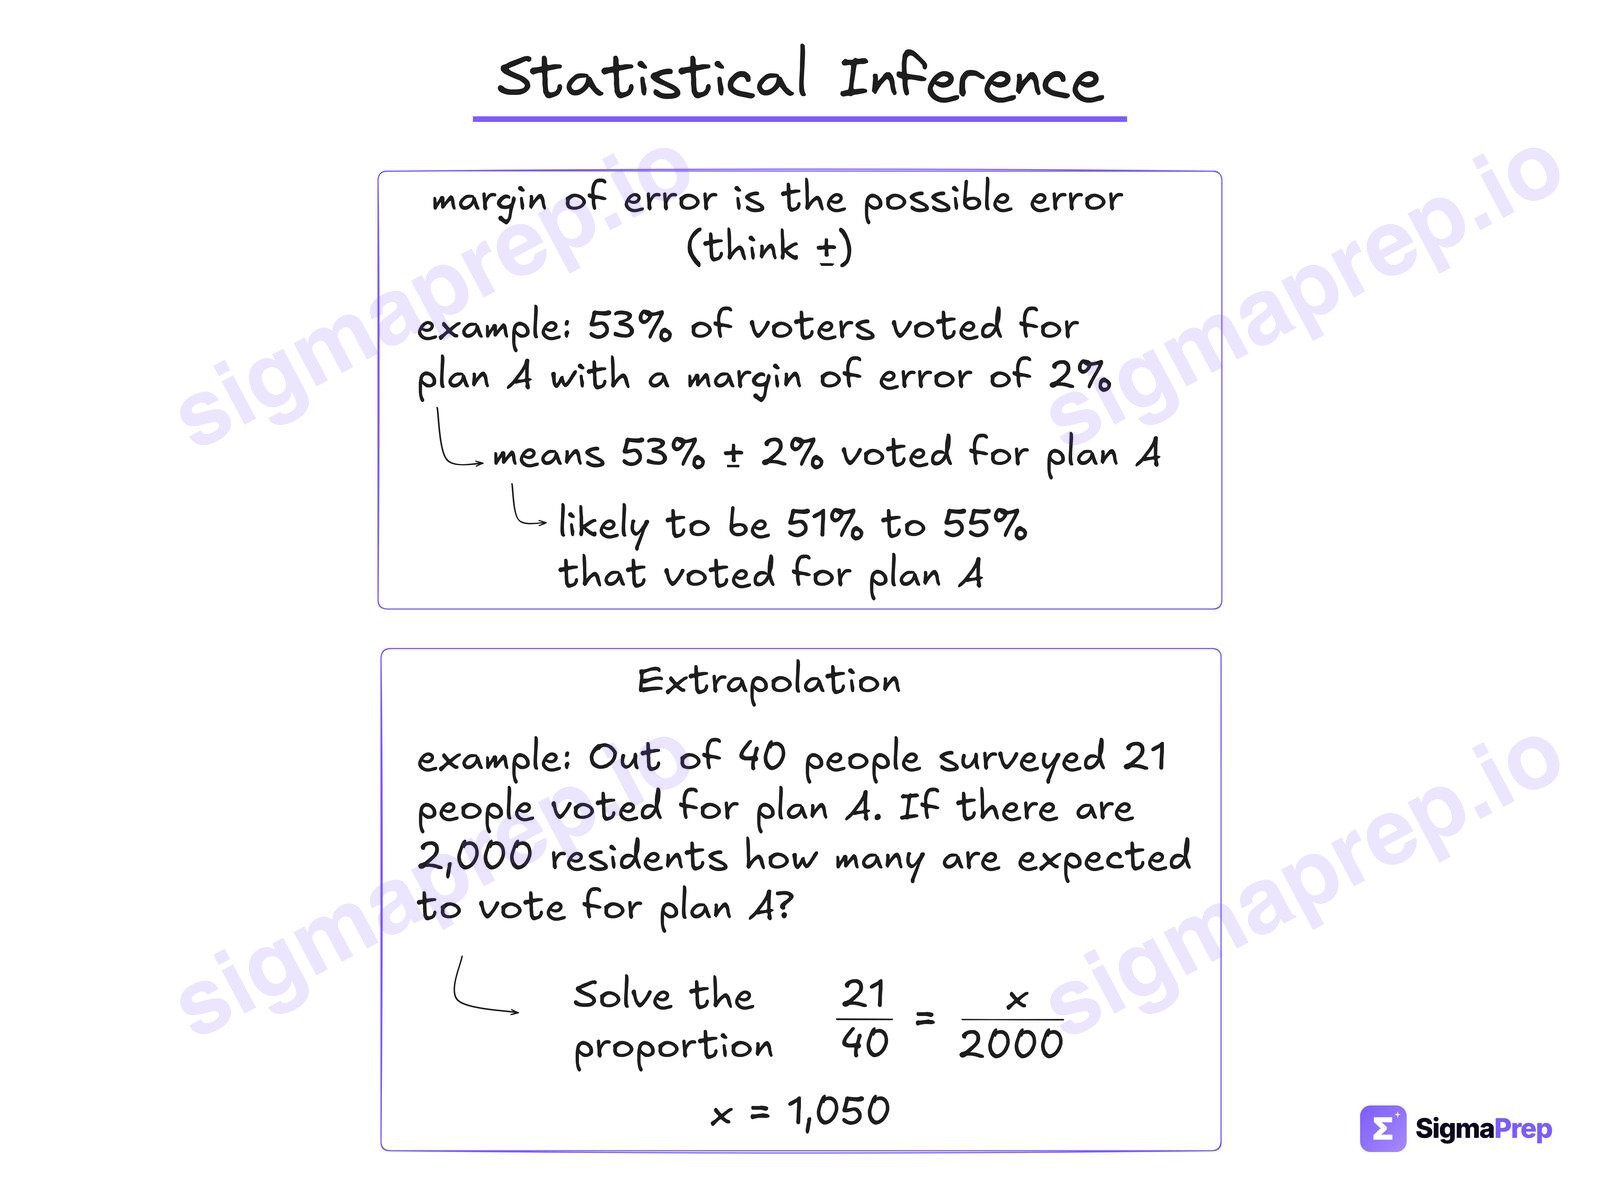
true value = estimate ± margin of error53% with a margin of 2% means 51% to 55%
Notes: Margin of error is a plus or minus around the reported number: the true value is most likely between the estimate minus the margin and the estimate plus the margin. If they give you the range instead, the margin is the distance from the middle to one end, not the whole width. For sample-to-population questions, set up the proportion and scale it up to the population.
Statistical Inference explained, with a solved SAT question →
Geometry and Trigonometry
About 15%. Angles, similar triangles, volume, right-triangle trig, and circles.
19. Angle Relationships
Lines, angles, and triangles
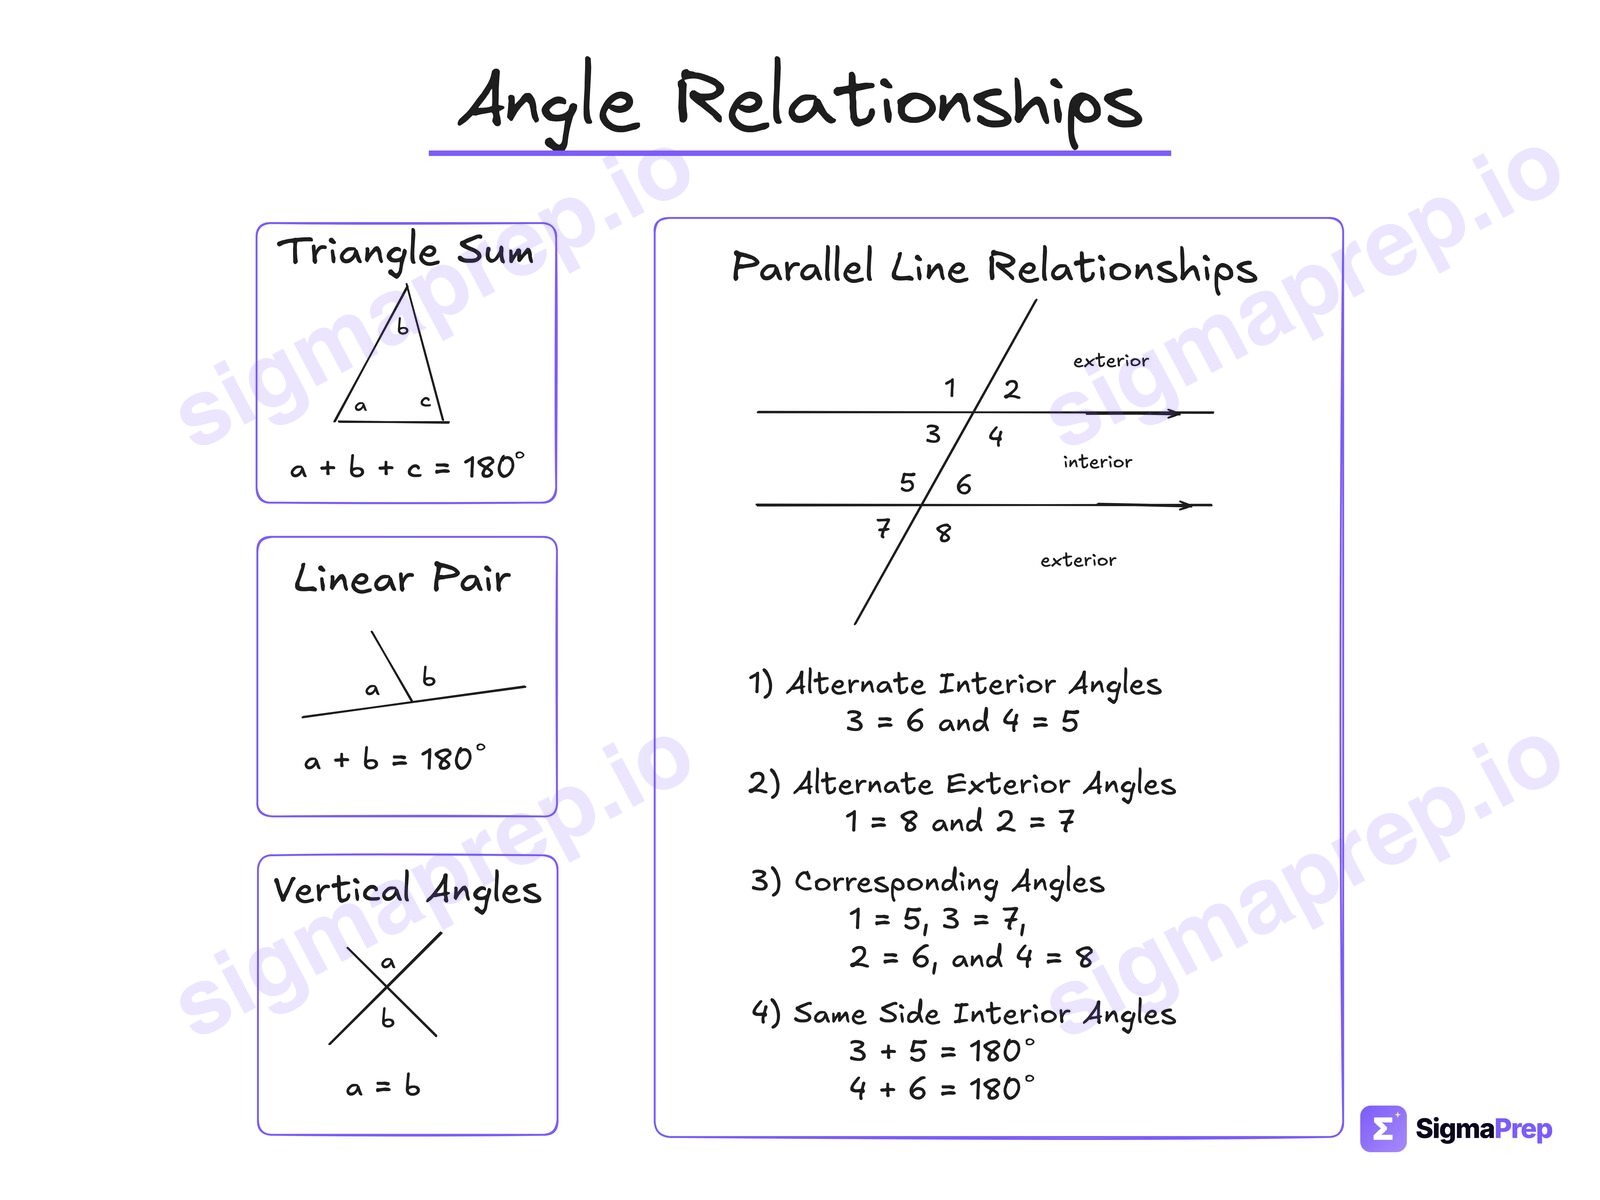
a + b + c = 180°linear pair: a + b = 180°vertical angles are equalThese three need no parallel lines
Notes: When they say parallel, you are using one of the parallel-line relationships: alternate interior, alternate exterior, corresponding, or same-side interior angles. The other relationships shown here do not require parallel lines and are always true: vertical angles, linear pair, and triangle sum.
Angle Relationships explained, with a solved SAT question →
20. Similar Figures
Lines, angles, and triangles
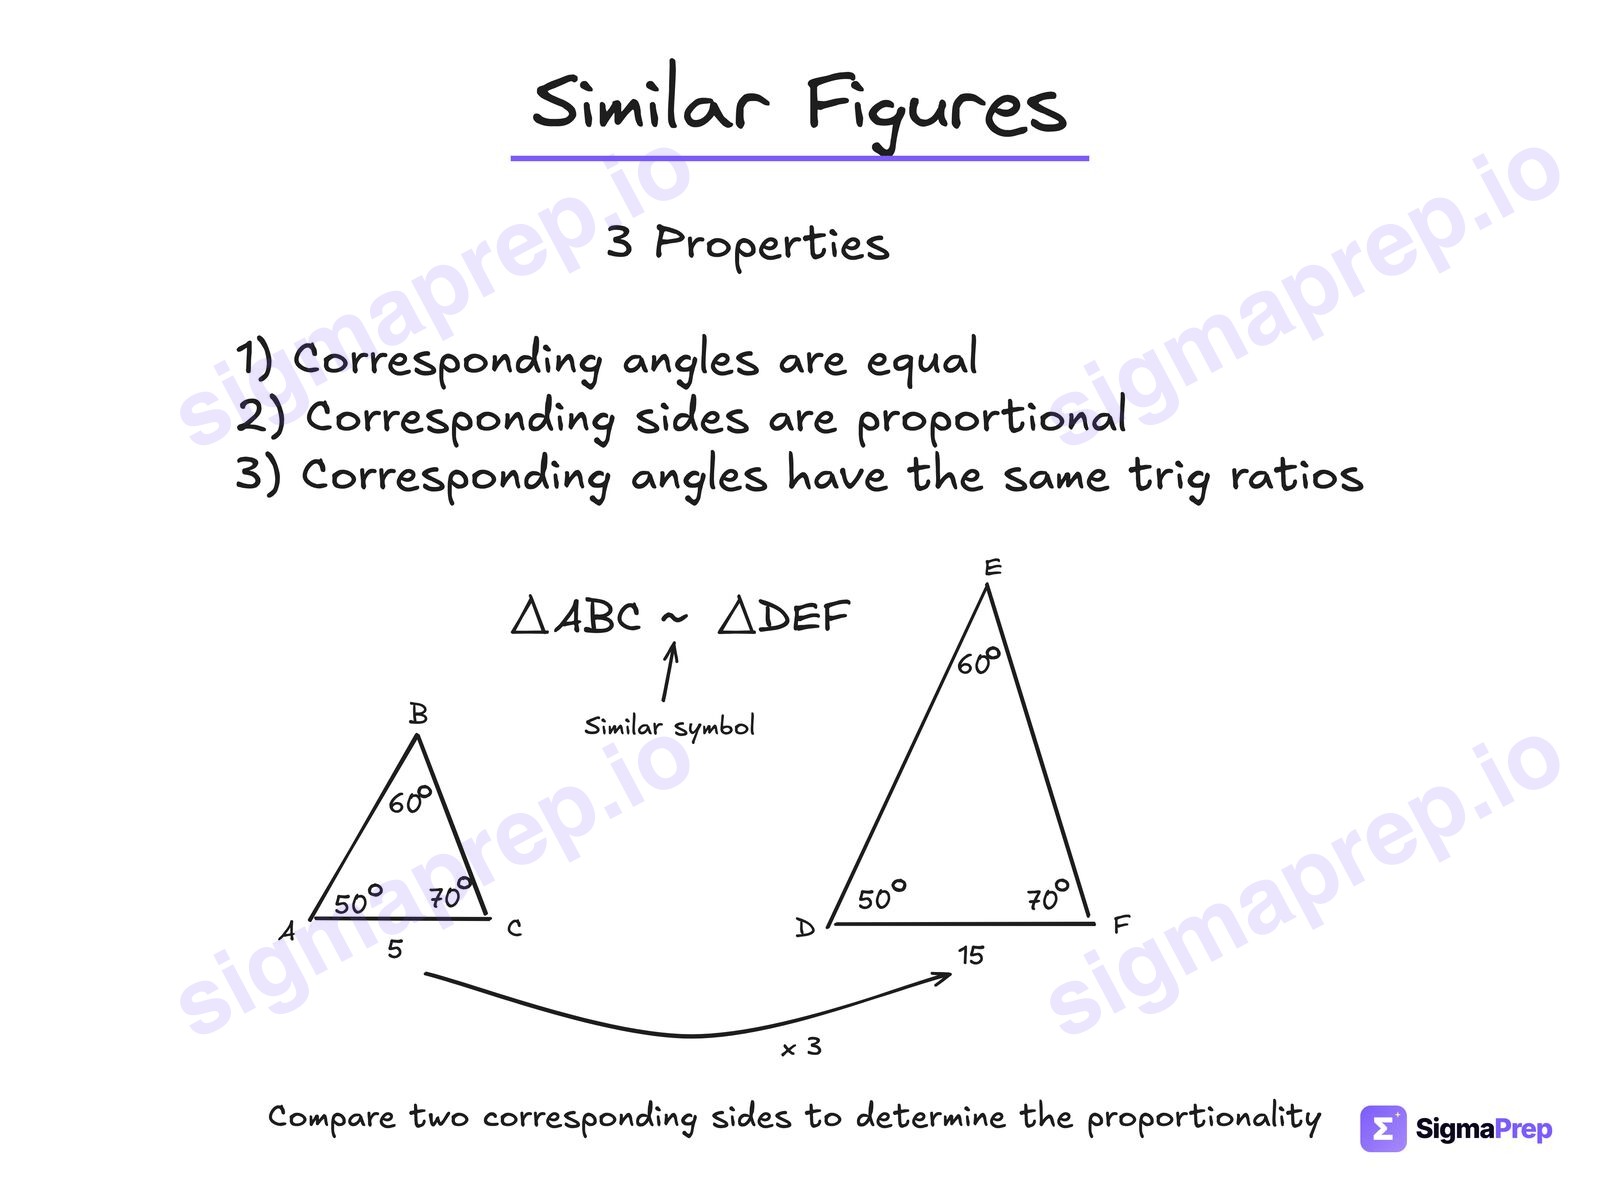
Notes: Similar figures are very common on the test, and it is super important that you always remember the first two properties. The third property, the one about trig, is not always used, but it is nice to know.
Similar Figures explained, with a solved SAT question →
21. Proportionality
Area and volume
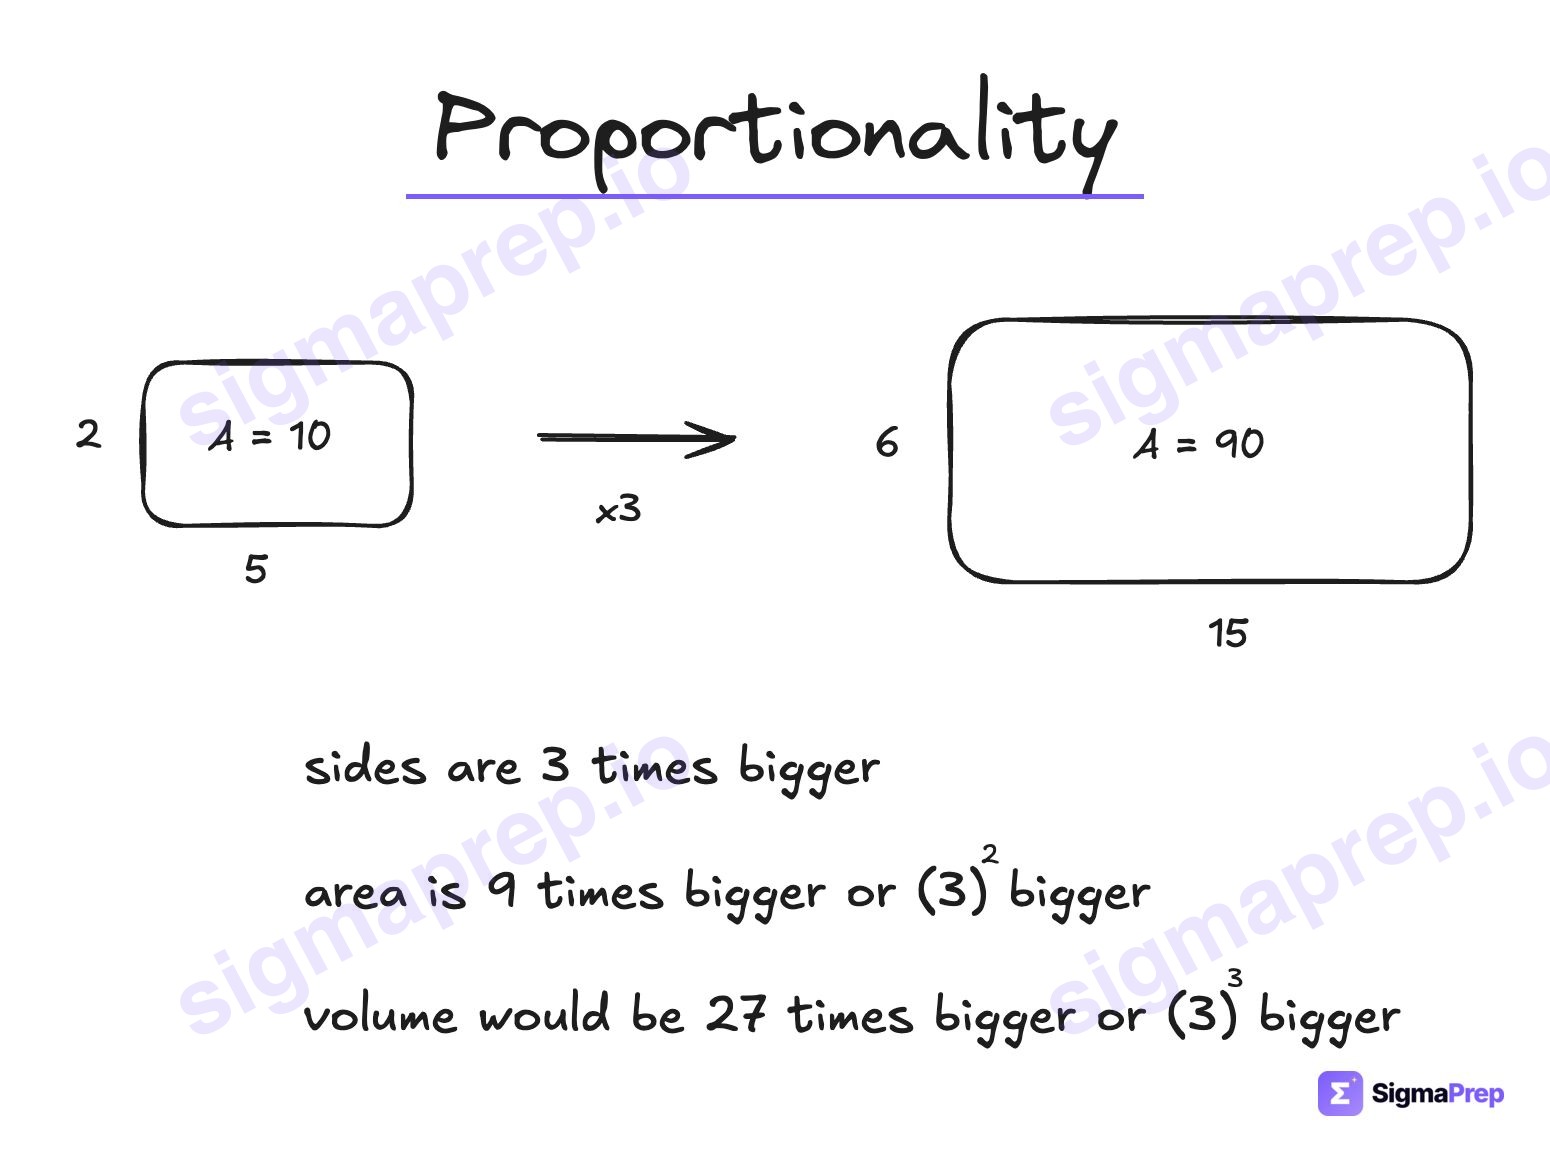
sides ×k → area ×k² → volume ×k³Sides three times bigger gives area nine times, volume twenty-seven
Notes: If the sides are k times bigger, the area is k squared times bigger and the volume is k cubed times bigger. Area is units squared, volume is units cubed. One calculation, not a whole recomputation.
Proportionality explained, with a solved SAT question →
22. Volume and Surface Area
Area and volume
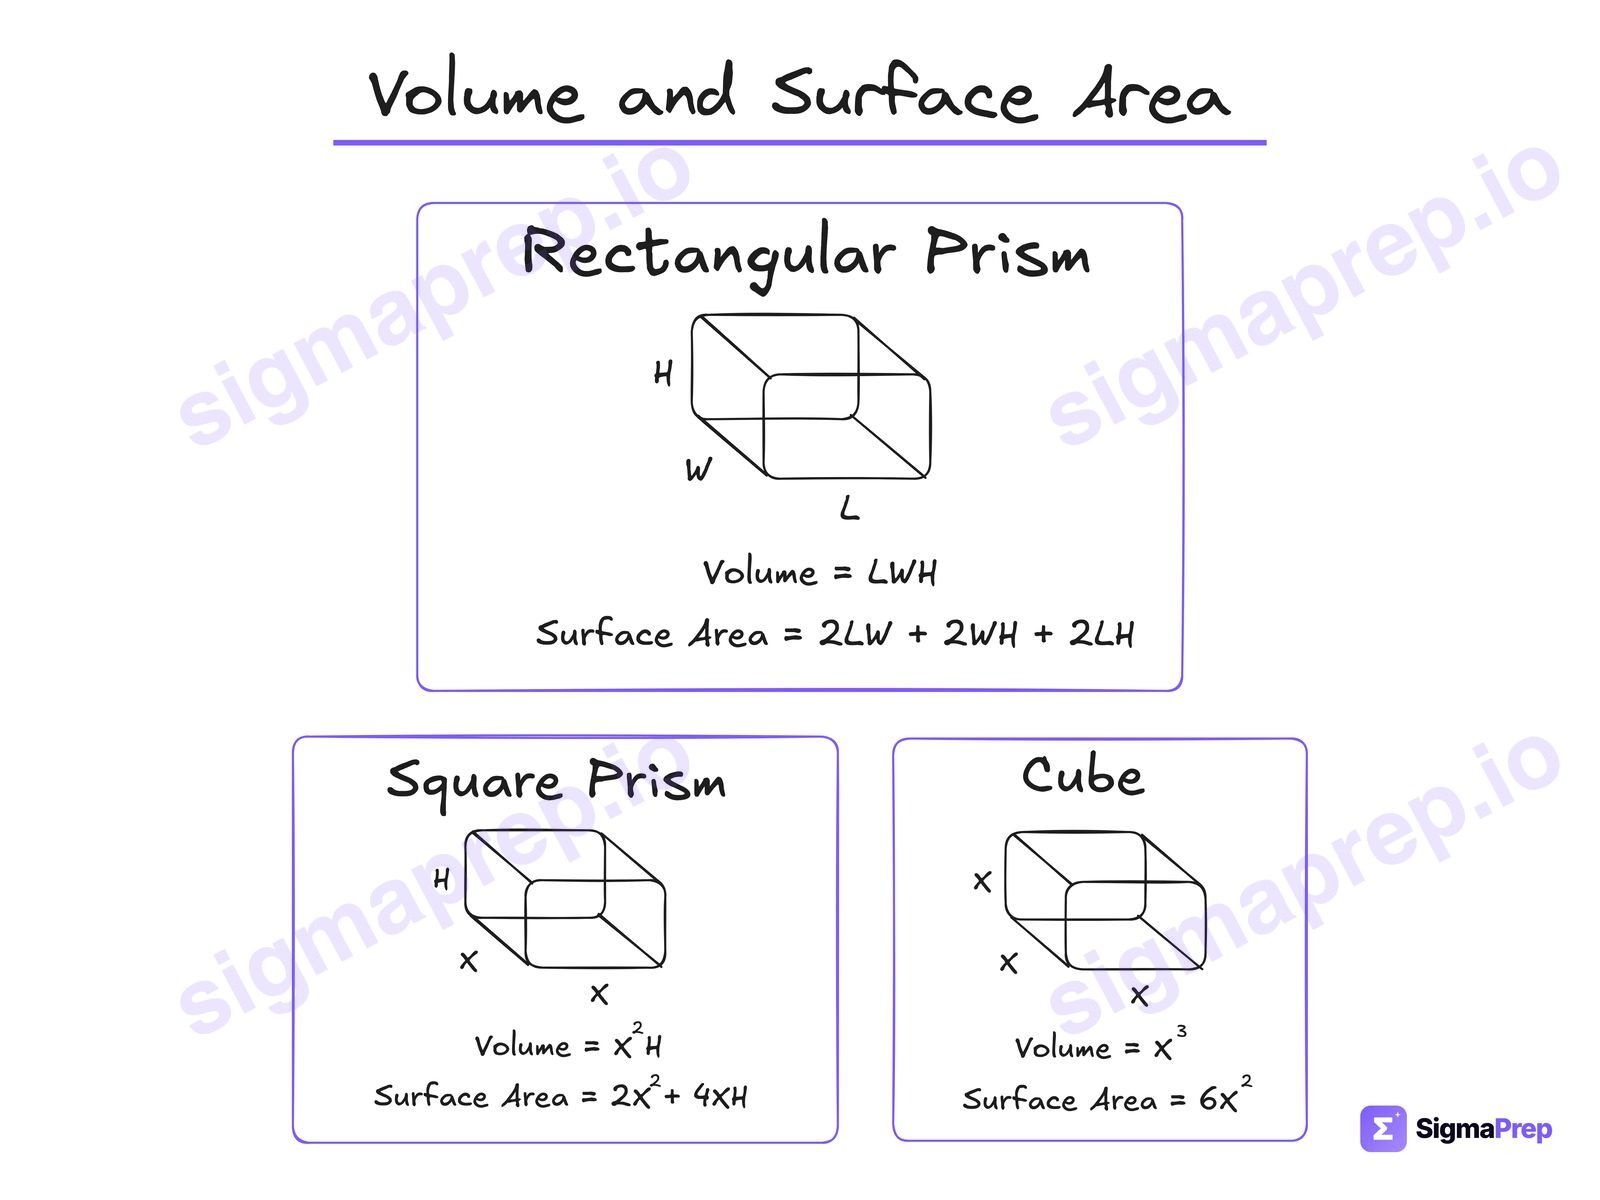
rectangular prism: V = LWH, SA = 2LW + 2WH + 2LHsquare prism: V = x²H, SA = 2x² + 4xHcube: V = x³, SA = 6x²The SAT gives you the prism volume on its reference sheet but not surface area
Notes: The SAT gives you the rectangular prism on its reference sheet, but it does not give you surface area. You need to be able to derive surface area by looking at the figure, or memorize it from here. The square prism and the cube are variations of a rectangular prism, with two sides the same and all three sides the same, respectively.
Volume and Surface Area explained, with a solved SAT question →
23. Trigonometry
Right triangles and trigonometry
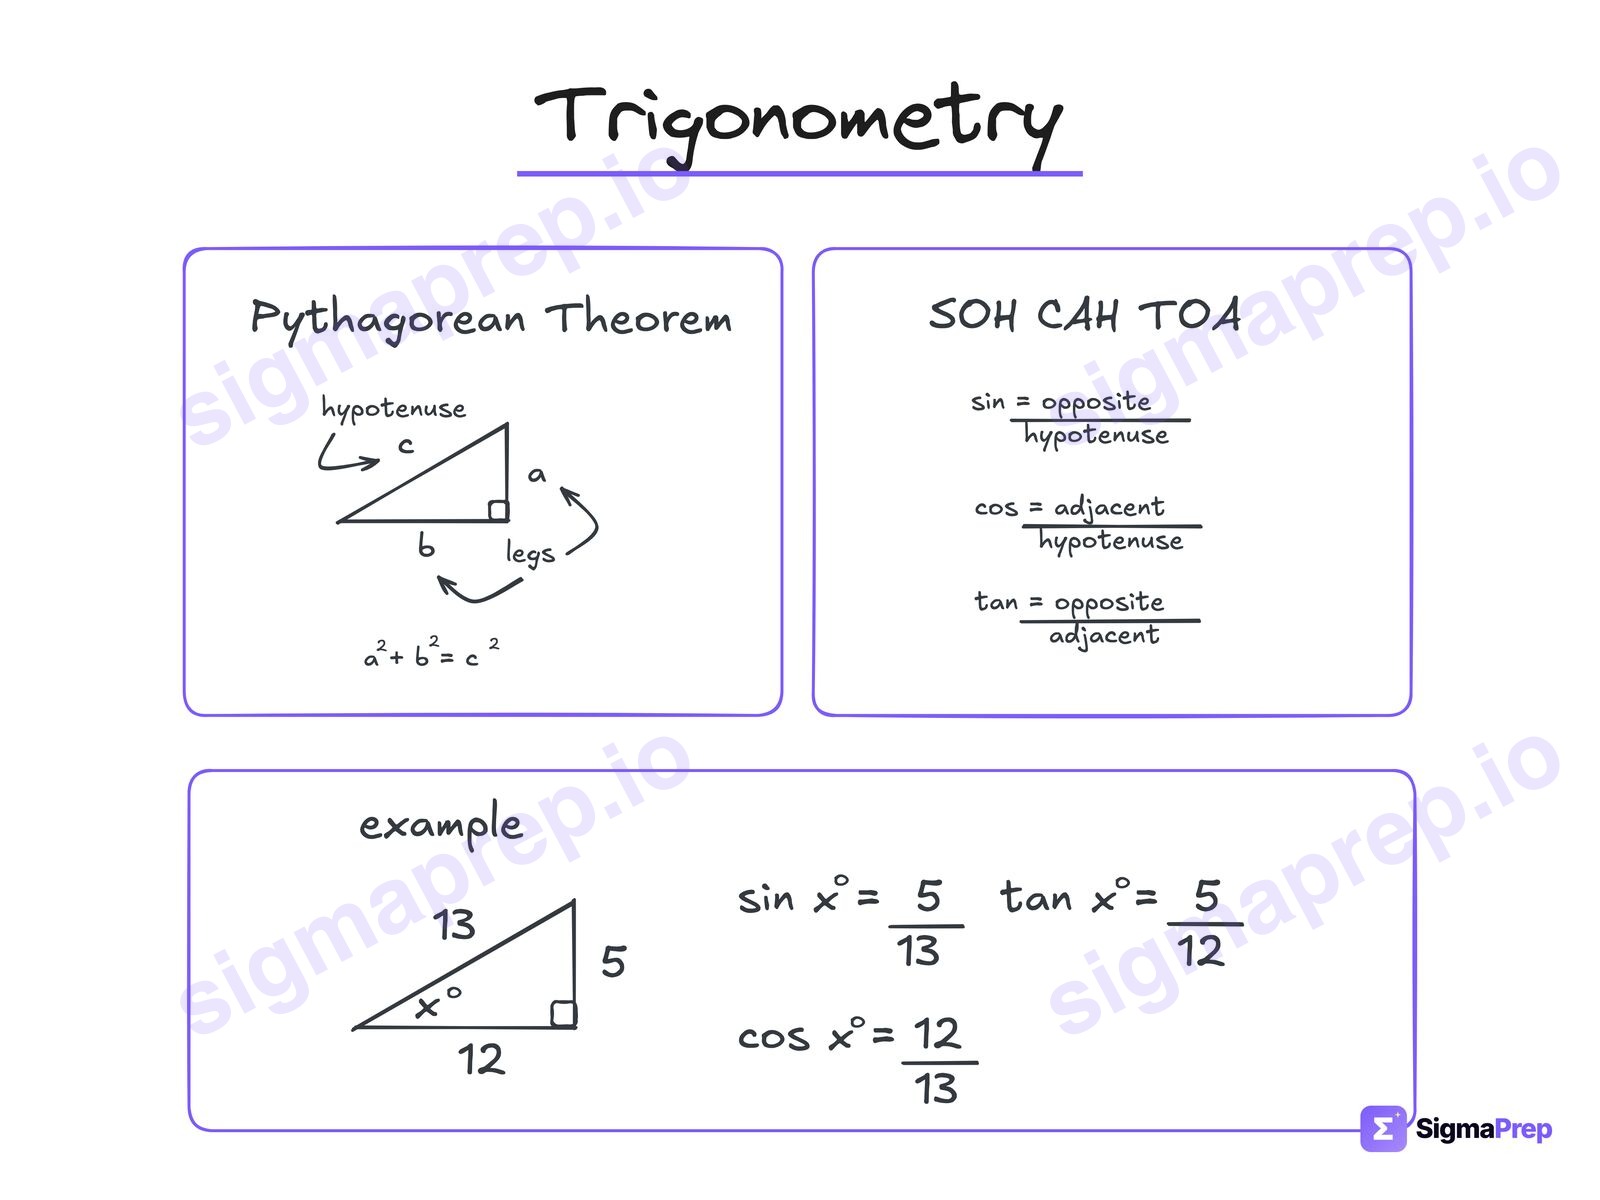
a² + b² = c²sin = oppositehypotenusecos = adjacenthypotenusetan = oppositeadjacentRight triangles only
Notes: SOH CAH TOA and the Pythagorean theorem ONLY apply to right triangles. Use the Pythagorean theorem to find a missing side. Trig questions just want a ratio.
Trigonometry explained, with a solved SAT question →
24. Circles
Circles
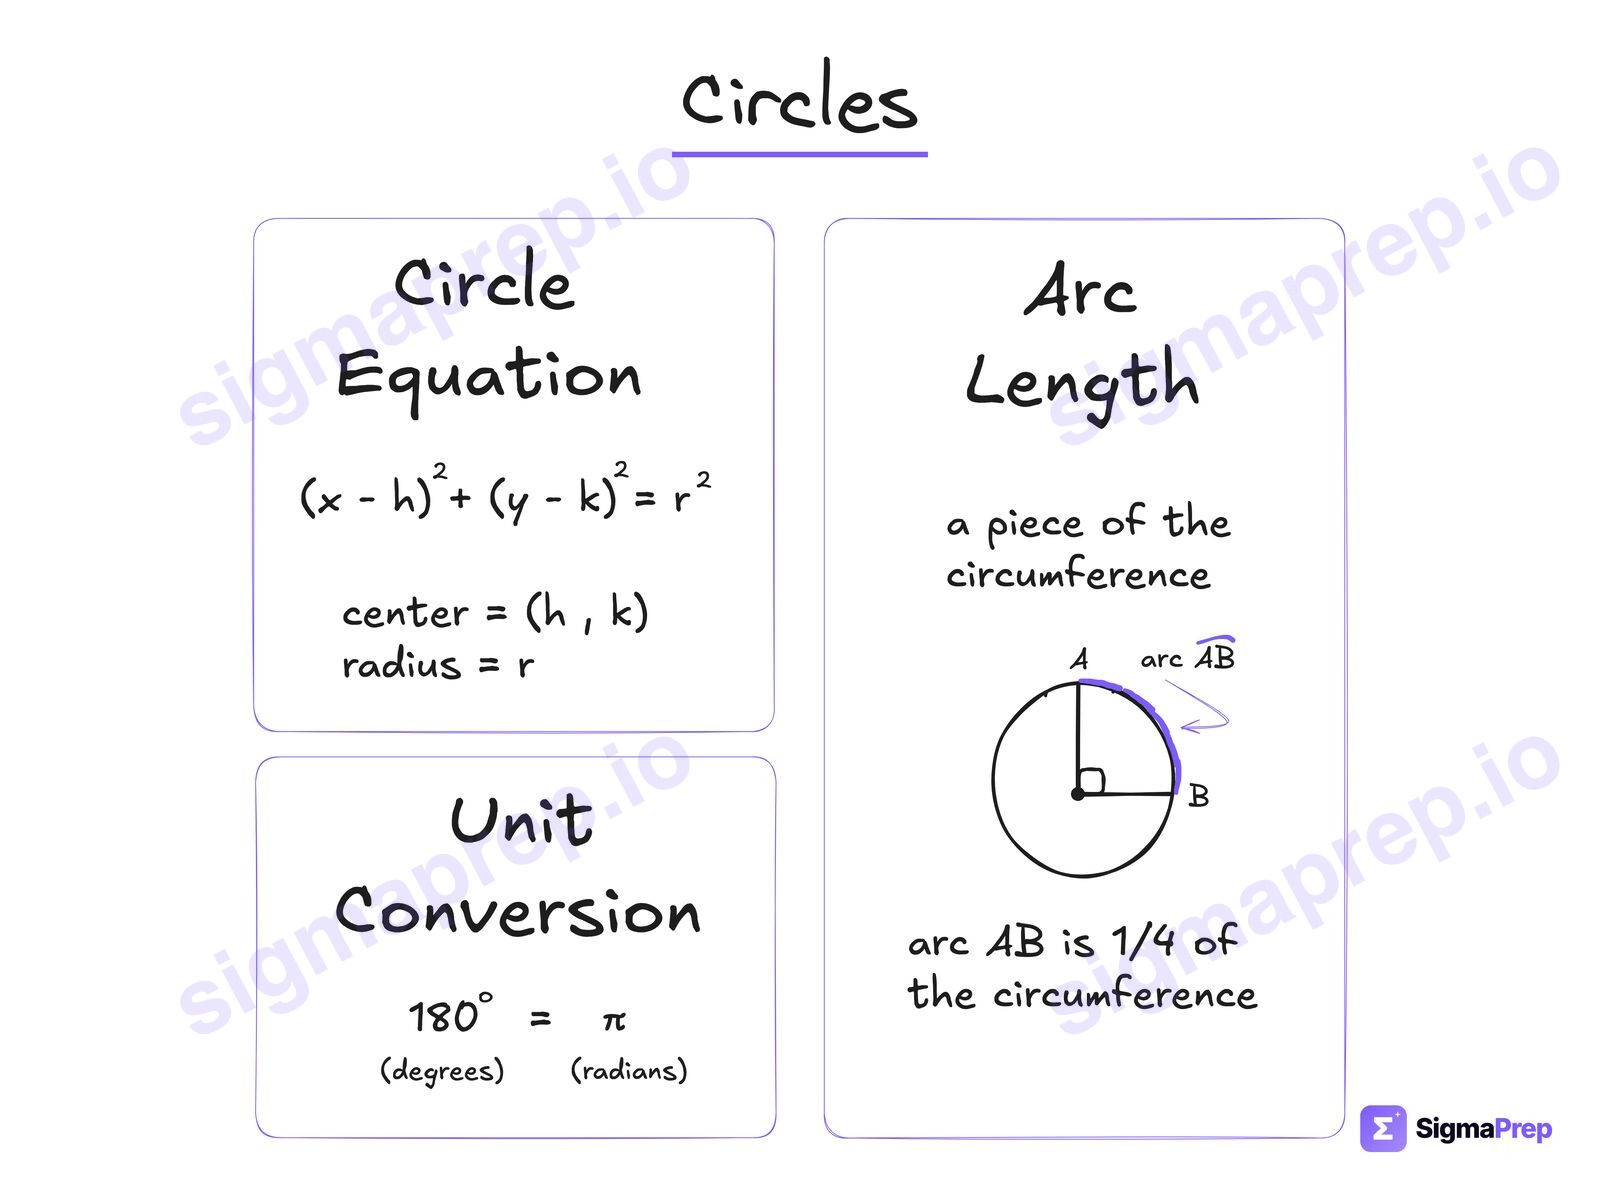
(x − h)² + (y − k)² = r²Center (h, k) with the signs flipped, radius squared on the right
Notes: The right side of (x - h)^2 + (y - k)^2 = r^2 is the radius SQUARED. A radius of 3m makes the right side 9m^2, not 3m^2, and a right side of 49k^2 means the radius is 7k. The center goes in with the signs flipped: center (5, 12) is (x - 5) and (y - 12). Two traps in one question, and both wrong answers are sitting in the choices.
Circles explained, with a solved SAT question →
How to use the sheet
- Learn the diagrams by using them through practice problems, not by staring at them.
- Use the examples to understand the concepts. Each diagram in the PDF has a real SAT question solved next to it; scan the code, or tap the link above, to watch a more in-depth explanation that uses Desmos.
- Try similar problems in the app to prove you can do it on your own.
See the diagrams in action
These are the exact notes I pull up mid-problem in the videos. If you want to watch them earn their keep on real questions: College Board added 196 new SAT Math questions and I solved every one, and the hardest of them are broken down in the 12 hardest SAT Algebra questions and the 20 hardest SAT Advanced Math questions. Not sure where to start? The SAT Math study plan tells you which of these pages to open first based on your score.
None of this is on the sheet the test gives you, and all of it is on the test. The PDF puts a real SAT question on the page facing each diagram, solved with it, and a code that opens the video where it is solved. Every one of the 24 has one. Get the PDF free →