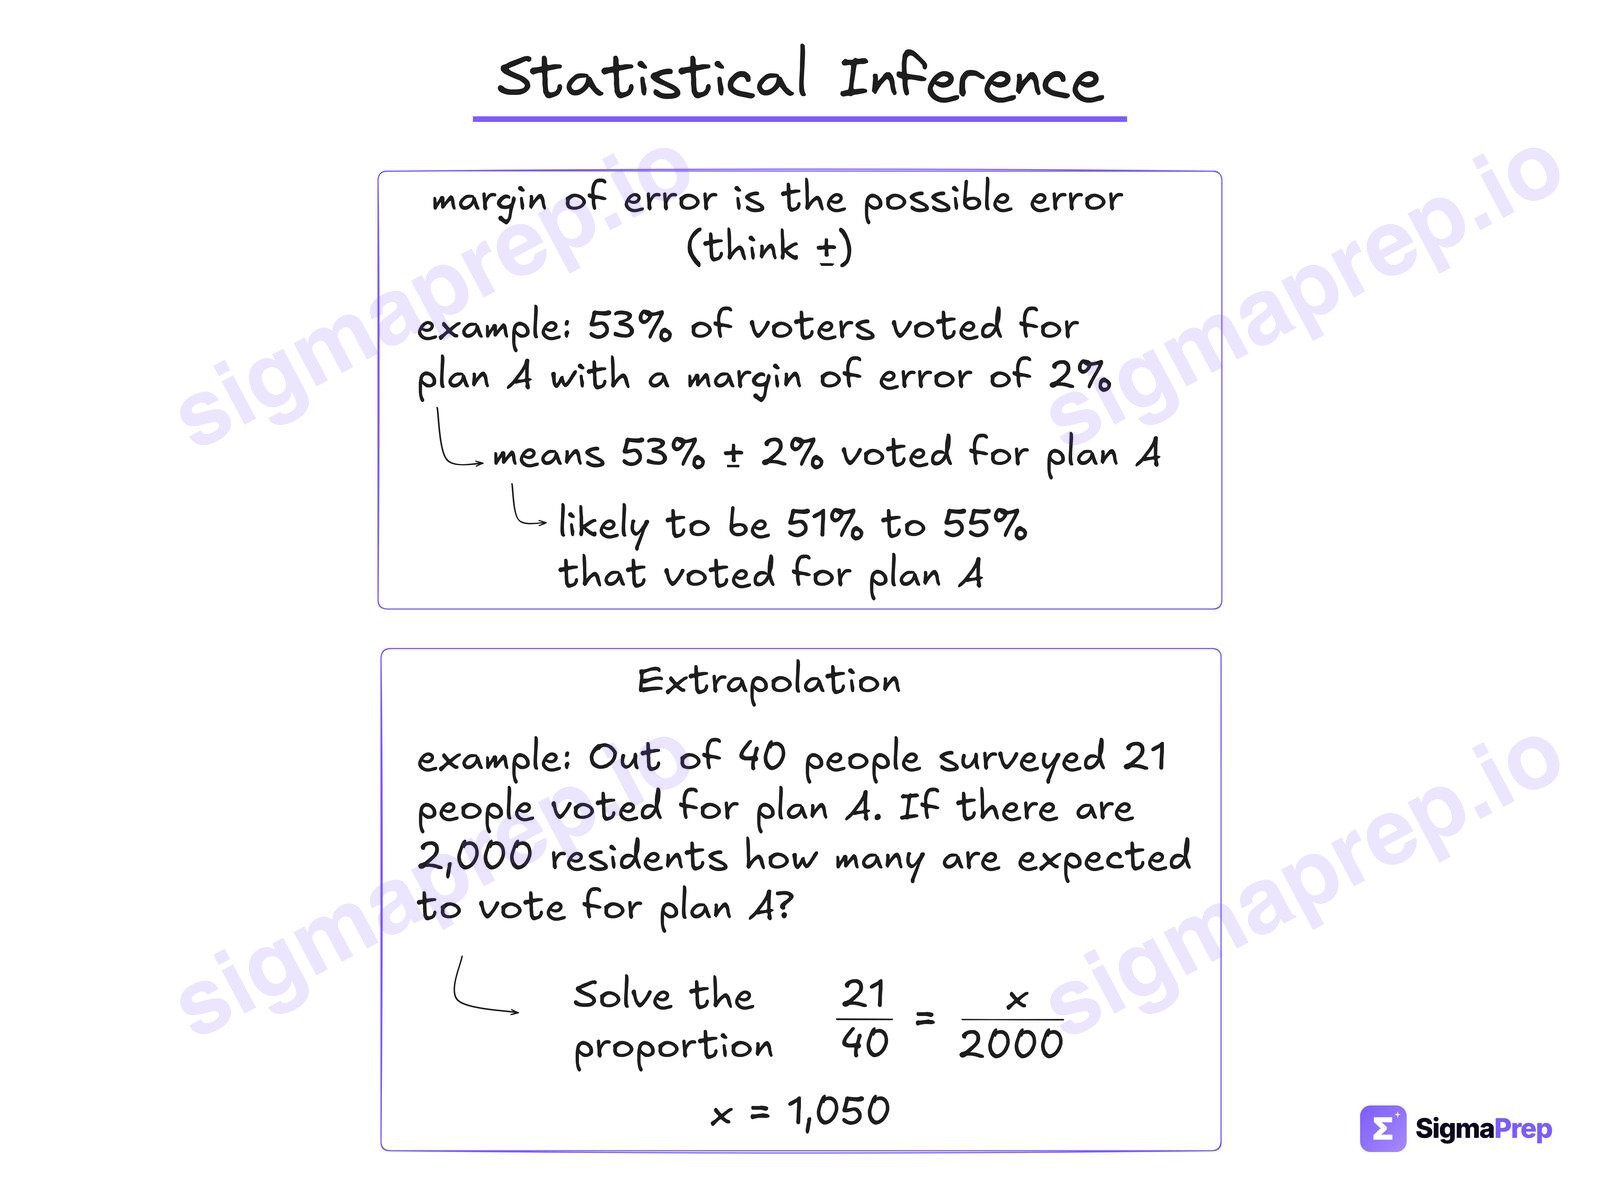
18. Statistical InferenceMargin of error is a plus or minus around the reported number: the true value is most likely between the estimate minus the margin and the estimate plus the margin. If they give you the range instead, the margin is the distance from the middle to one end, not the whole width. For sample-to-population questions, set up the proportion and scale it up to the population.Worked example in the app →
This skill lives inside Problem-Solving and Data Analysis, about 15% of SAT Math, and it is the one where students who are good at math lose points to wording. There are two calculations, scaling a sample up to a population and building a plus-or-minus range, and one idea that the answer choices are written to test: a sample tells you about the population it came from, approximately, and nothing more.
Plus or minus
Margin of error is a plus or minus around the reported number. Estimate 28% with margin 3.5% means the true value is most likely between 24.5% and 31.5%. If they give you the range instead, the margin is the distance from the middle to one end, not the whole width. Every correct answer on this topic says "plausible" or "between." Every wrong one says "exactly," "every," or "no conclusion."
The five ways the SAT asks it
1. Scale the sample to the population
Inference from Sample Statistics and Margin of Error · Easyanswer D
There are 60 students in a photography club. A survey of a random sample of the club members found that 25% of those surveyed would like to participate in a weekend photo walk. Based on this survey, what is the best estimate of the number of students in the photography club who would like to participate in a weekend photo walk?
25% of the sample said yes, so the best estimate for the club is 25% of 60, which is 15. The sample percent is assumed to hold for the whole group. The choice 25 is the percent mistaken for a count.
2. What the margin of error means
Inference from Sample Statistics and Margin of Error · Easyanswer B
A quality control inspector measured the volume of a random sample of water bottles and found the mean volume to be 502.5 milliliters, with a margin of error of 0.03 milliliters. Which of the following is the most appropriate conclusion about all water bottles produced at the factory?
AThe mean volume of all water bottles produced at the factory is exactly 502.5 milliliters
✓The mean volume of all water bottles produced at the factory is between 502.47 and 502.53 milliliters
CEvery one of the water bottles has a volume between 502.47 and 502.53 milliliters
DThe mean volume of the water bottles in the sample is between 502.47 and 502.53 milliliters
502.5 plus or minus 0.03 is a range for the mean of all bottles, 502.47 to 502.53. Not exactly 502.5, not every bottle, and not the sample's mean, which is known already. The interval is a statement about the population mean.
3. The appropriate conclusion
Inference from Sample Statistics and Margin of Error · Mediumanswer C
A sample of 650 adults who own smartphones was selected at random. It was estimated that 28% of all adults who own smartphones use their smartphones to read the news, with an associated margin of error of 3.5%. Which of the following is the most plausible conclusion about all adults who own smartphones?
ASince the sample included adults who own smartphones who do not use their smartphones to read the news, no valid conclusion can be drawn about the population
BMore than 31.5% of all adults who own smartphones use their smartphones to read the news
✓Between 24.5% and 31.5% of all adults who own smartphones use their smartphones to read the news
DSince the sample did not include all adults who own smartphones, no valid conclusion can be drawn about the population
28 ± 3.5 gives 24.5% to 31.5%, and the right answer says exactly that. The two "no valid conclusion" choices are always wrong: a random sample is the whole point, and it does not need to include everyone. "More than 31.5%" is the top of the range treated as a floor.
4. Plausible values for the population
Inference from Sample Statistics and Margin of Error · Mediumanswer B
To estimate the proportion of a population who prefer online shopping, a random sample was selected. Based on the sample, the estimated proportion is 0.62, with an associated margin of error of 0.05. Which of the following is the most appropriate conclusion about the population proportion?
AThe proportion of the population who prefer online shopping is exactly 0.62
✓It is plausible that the proportion of the population who prefer online shopping is between 0.57 and 0.67
CIt is plausible that the proportion of the population who prefer online shopping is less than 0.57
DIt is plausible that the proportion of the population who prefer online shopping is greater than 0.67
0.62 ± 0.05 is 0.57 to 0.67, and the answer is the one that stays inside it and says "plausible." The choices that say "exactly" or step outside the range are the same wrong answer in different clothes.
5. The harder scale-up
Inference from Sample Statistics and Margin of Error · Hardanswer A
In the state, Ms. Rivera's 7th-grade class of 28 students was surveyed. 32.1% of the students reported having at least 3 extracurricular activities. The average 7th-grade class size in the state is 28. If the students in Ms. Rivera's class are representative of all 7th-grade students in the state, and there are 2,200 such classes, which of the following best estimates the number of 7th-grade students in the state who have fewer than 3 extracurricular activities?
Three steps hidden in one paragraph: the state has 2,200 classes of 28, so 61,600 students; 32.1% have at least 3 activities, so 67.9% have fewer; 0.679 × 61,600 is about 41,800. The choice 19,800 answers the opposite question, and 61,600 forgets to take the percent at all. Read for the word "fewer."
Try one
This is a real question from our Margin of Error · Medium set. Solve it the fast way, then watch how I do it.
try one · Margin of error · Medium
There are 40,000 registered voters in a city. From a random sample of 800 registered voters, it was estimated that 42% of the registered voters in a city support a new parks initiative, with an associated margin of error of 4%. Which of the following is a plausible value for the total number of registered voters in a city who support a new parks initiative?
Where the points actually go
Picking a choice that says "exactly," answering the opposite of what was asked, and treating the sample as if it were the population. The math is a percent of a number; the rest is reading the answer choices for one forbidden word.
The app has 161 questions on this skill, 63 easy, 70 medium and 28 hard, every one with a video explanation. The free diagnostic shows whether this is where your points are going.
Common Questions
A plus-or-minus range around the sample estimate inside which the true population value plausibly falls. An estimate of 28% with a margin of error of 3.5% means the population value is plausibly between 24.5% and 31.5%.
Apply the sample percent to the whole population. If 25% of a random sample from a 60-member club said yes, the best estimate is 25% of 60, or 15 members.
Any choice that says the population value is "exactly" the estimate, that "every" individual falls in the range, or that "no conclusion can be drawn" from a random sample. The correct choice says the value is plausibly between the two ends of the range.
Use a larger random sample. Sample size is the only thing in these questions that changes the margin; a bigger sample gives a smaller margin and a tighter range.
Want more SAT tips like this?
One article a week. No spam.
Ready to raise your SAT Math score?
Take the free Diagnostic Quiz and see where you stand. No payment required.