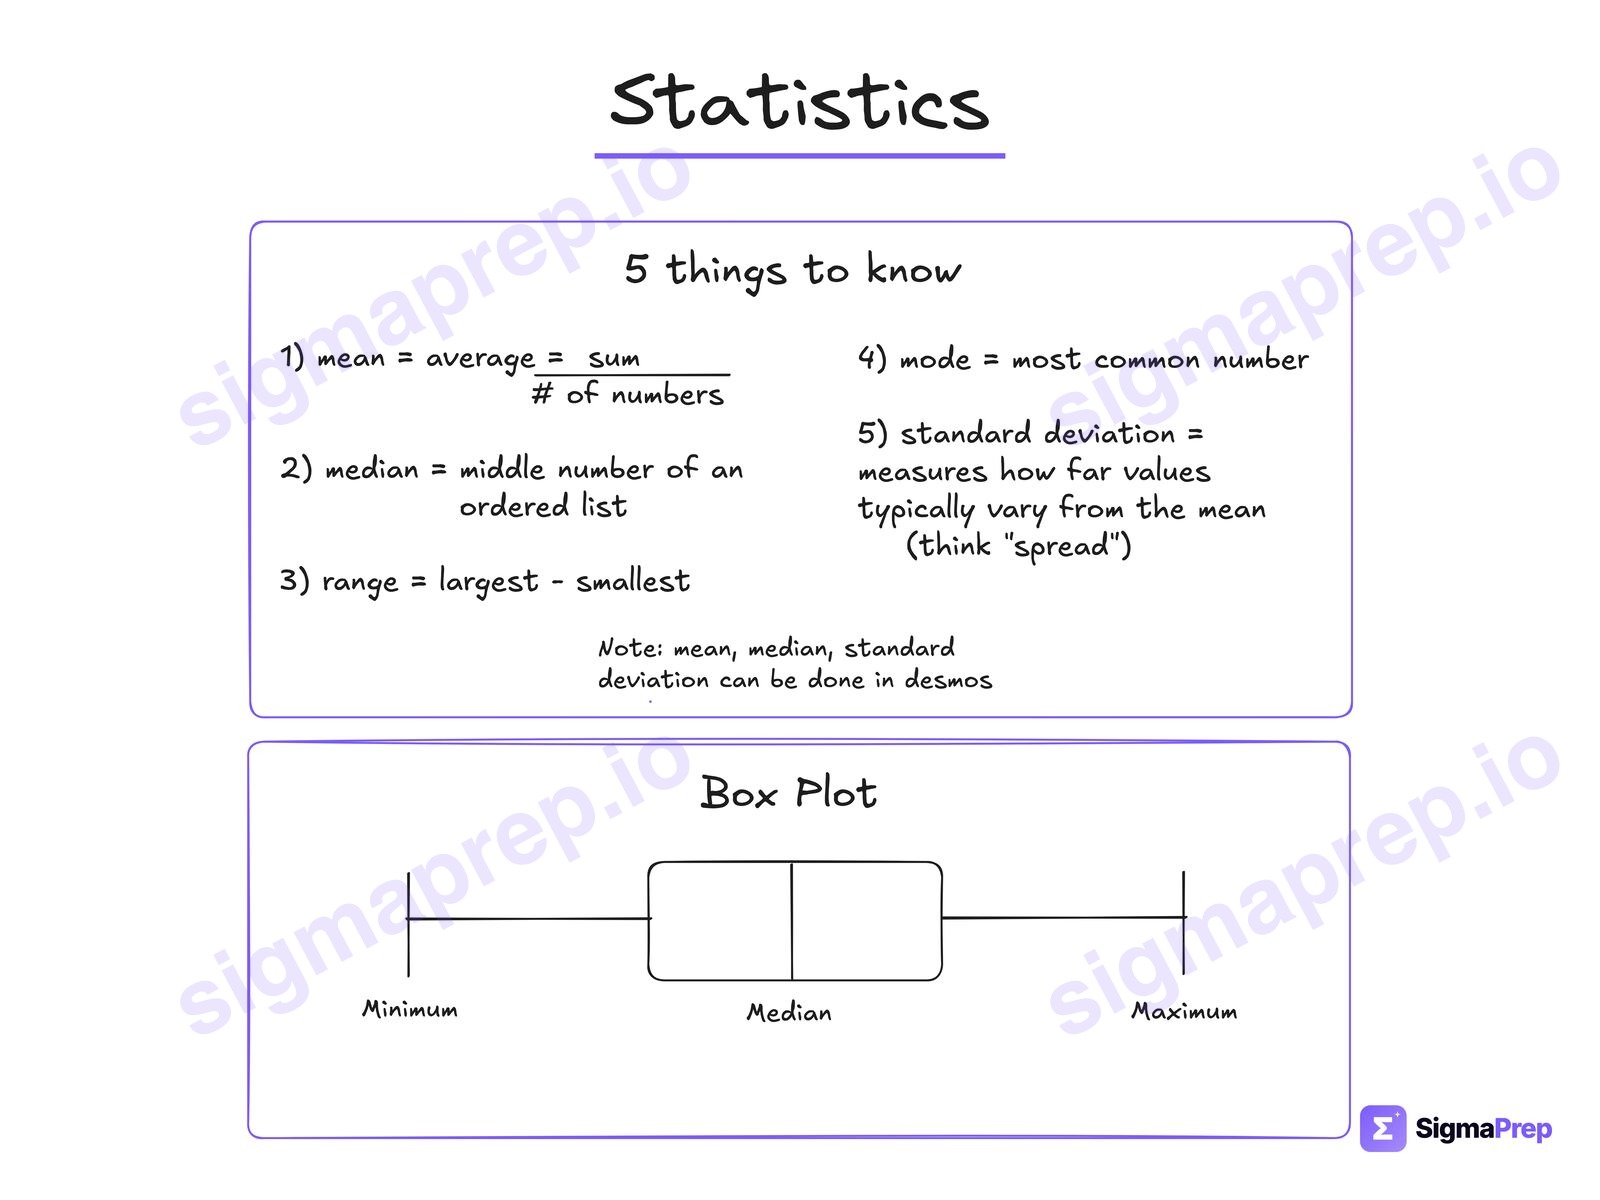
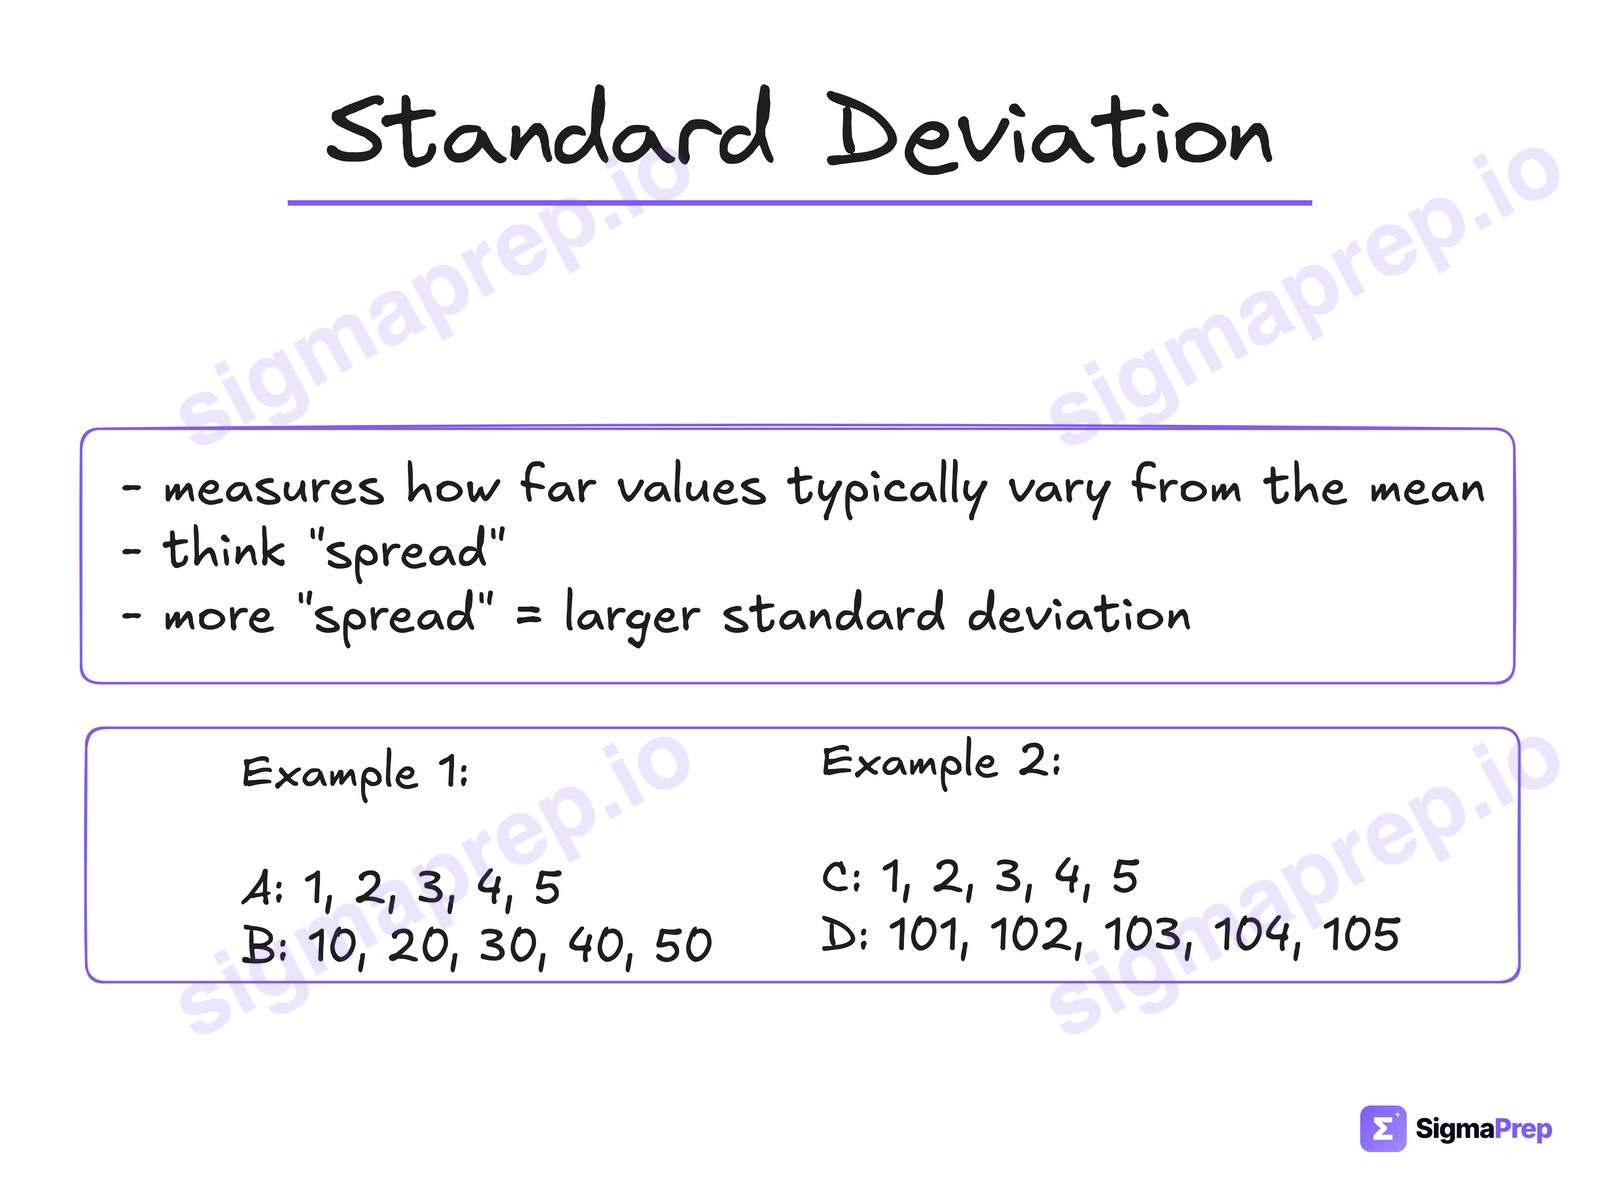
15. StatisticsKnow these 5 calculations for statistics. Mean, median, and standard deviation can be computed in Desmos. Range and mode MUST be memorized, because Desmos will not do them for you.Worked example in the app →16. Standard DeviationFor standard deviation, simply think of spread. Just remember that one word. In the examples above, B has more spread than A, so B has the larger standard deviation. C and D always go up by 1, so their spreads are the same.Worked example in the app →
Statistics on the SAT is not a statistics course. It is five calculations, mean, median, mode, range and standard deviation, and two ideas about them. Three of the five, mean, median and standard deviation, Desmos computes for you if you type the list in. Range and mode you have to know, because Desmos will not do them. This lives inside Problem-Solving and Data Analysis, about 15% of SAT Math.
The two ideas
First: the median is the middle of the sorted list, so an outlier drags the mean and leaves the median alone. Second: standard deviation is spread. Just that word. More spread out, larger standard deviation. You will never compute one by hand on this test; you will compare two lists and say which is more spread out.
Sort first: 3, 3, 3, 5, 5, 7, 8, 11, 14. Nine values, the fifth is the middle, 5. The choice 7 is for people who took the middle of the list as written. With an even count, the median is the average of the two middle values. Desmos gives median(list) directly if you would rather not sort.
2. Reading a frequency table
One-variable data · Mediumanswer 28
The frequency table below shows the distribution of values in a data set with 38 data values.
A frequency table is a list in disguise: 20 appears twice, 21 five times, and so on. The maximum is the largest value that actually occurs, 28, not 27 with its frequency of zero. When they ask for the mean or median of a table, expand it into a list in Desmos or count down the frequencies to the middle position.
3. Mean versus median
One-variable data · Mediumanswer A
Four data sets are shown below. Which of the following data sets has a mean that is greater than its median?
Seven 3s and a 100. The median is 3, the mean is pulled way up by the outlier. A single big value on the high end makes the mean greater than the median; a big value on the low end does the reverse; a symmetric list has them equal. You do not need to compute anything to answer this one.
4. Standard deviation is spread
One-variable data · Mediumanswer C
A teacher recorded the test scores for two classes. Each class had 30 students. The mean score for both classes was 78, but the standard deviation for Class A was 5.3 and the standard deviation for Class B was 11.7. Which of the following is the best conclusion based on this information?
AA student in Class B scored the highest on the test
BThe data sets for the two classes are identical
✓The scores in Class B had a larger spread than the scores in Class A
DThe median score for Class B is greater than the median score for Class A
Same mean, bigger standard deviation, so Class B's scores are more spread out. That is all a standard deviation tells you. It does not say who scored highest, and it says nothing about the median. Both wrong choices claim something the number cannot support.
5. Combining or shifting a data set
One-variable data · Hardanswer 40
Data set A contains 80 values with a mean of 30. Data set B contains 40 values with a mean of 60. Data set C is created by combining all values from A and B. What is the mean of data set C?
Not the average of the two means. The combined mean is the total of everything over the total count: 80 × 30 plus 40 × 60 is 4,800, over 120 values, is 40. Weight each mean by how many values it came from. The related question adds a constant to every value: the mean and median move by that constant, the range and standard deviation do not move at all.
Try one
This is a real question from our One-Variable Data · Medium set. Solve it the fast way, then watch how I do it.
try one · One-variable data · Medium
The mean and the median of the five data values shown are equal. Which of the following is NOT a possible value of x?
10,14,20,24,x
Where the points actually go
Taking the median of an unsorted list, averaging two means instead of weighting them, and reading a standard deviation as something other than spread. Three habits, each fixed by seeing the question shape enough times.
The app has 336 one-variable data questions, 105 easy, 112 medium and 119 hard, every one with a video explanation. The free diagnostic shows whether this is where your points are going.
Common Questions
How spread out the values are from the mean. The test never asks you to compute it; it asks you to compare two data sets and say which has the larger spread. A list that goes up by 10 each time has a larger standard deviation than one that goes up by 1.
An outlier pulls the mean toward it and leaves the median nearly unchanged, because the median only depends on the middle of the sorted list. A large high value makes the mean greater than the median.
Total of all values divided by total count: multiply each mean by its number of values, add, and divide by the combined count. It is a weighted average, not the average of the two means, unless both sets are the same size.
Yes. Type mean(1, 2, 3, 4, 5) and Desmos gives 3; median(1, 2, 3, 4, 5) and stdev(1, 2, 3, 4, 5) work the same way. For a long list, type L = [1, 2, 3, 4, 5] first and then mean(L). Range and mode are not built in, so know that range is max minus min and mode is the most frequent value.
Want more SAT tips like this?
One article a week. No spam.
Ready to raise your SAT Math score?
Take the free Diagnostic Quiz and see where you stand. No payment required.