This is one of those problem types where students waste a ton of time doing it the hard way when Desmos can solve it in about 10 seconds. Let's walk through a real example.
The Problem
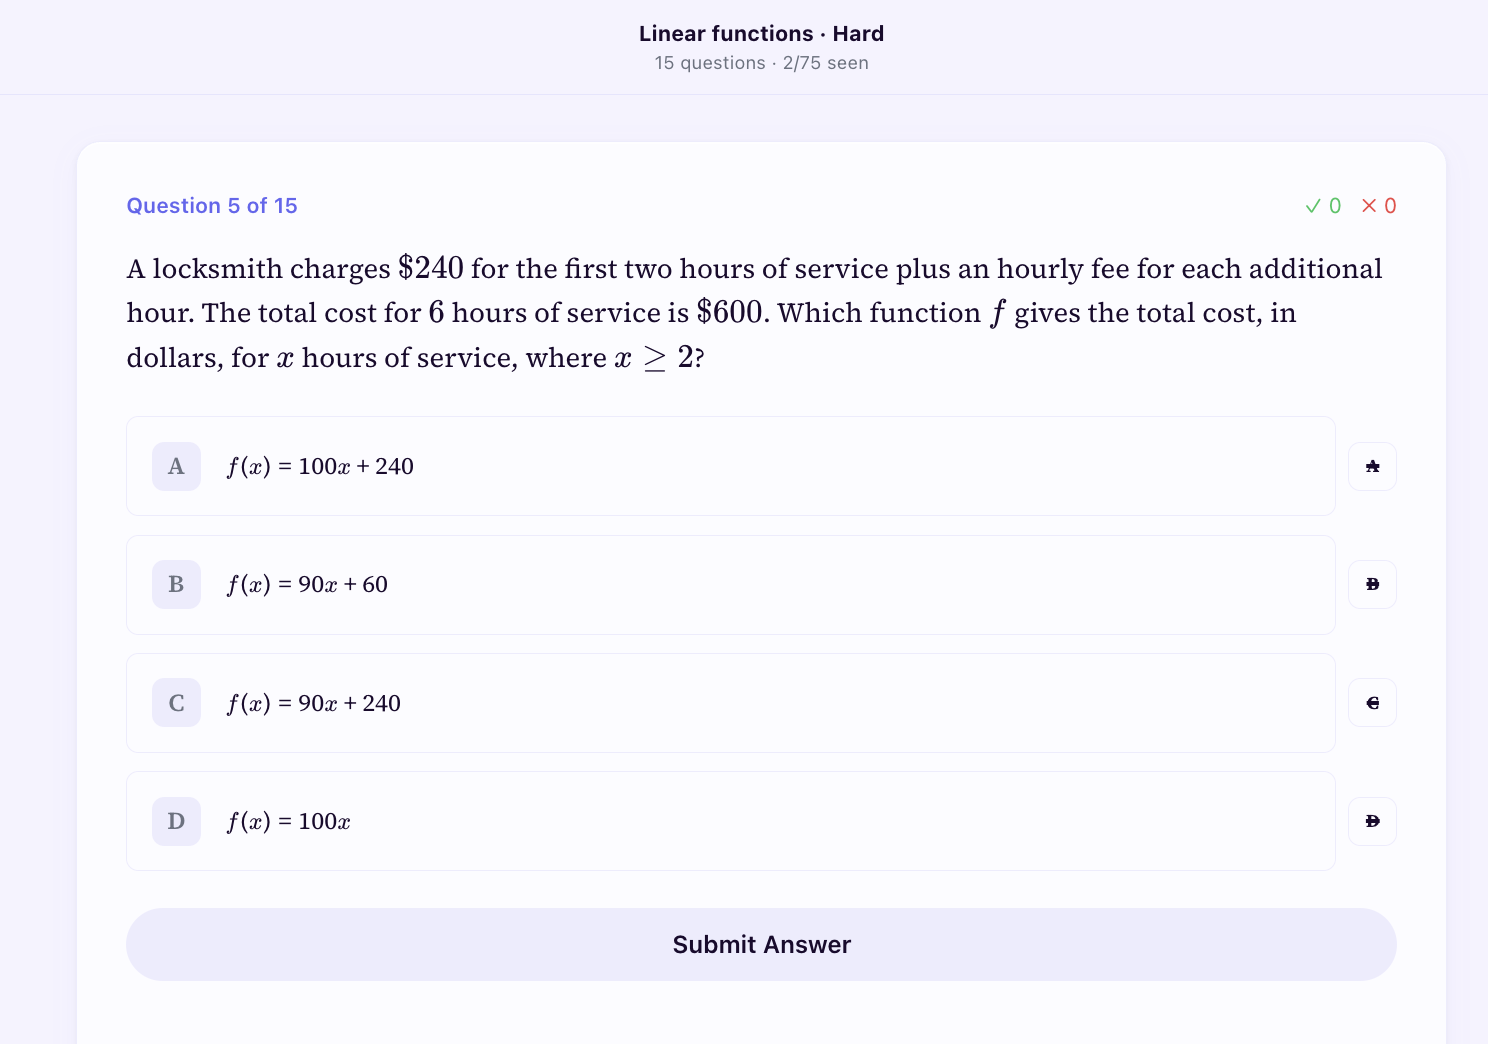
Read this carefully. A locksmith charges $240 for the first two hours. The total cost for 6 hours is $600. You need to find the function that gives the total cost for x hours of service.
Most students look at this and immediately try to figure out the hourly rate, set up an equation, account for the first two hours being different... it gets messy. And the most common wrong answer is C (f(x) = 90x + 240) because it sounds like it should be right. $240 for the first part plus $90 per hour after that? Makes sense intuitively. But it's wrong.
Why Students Get This Wrong
The trap is that students try to break the problem into pieces. They think about the first two hours separately from the remaining hours. But the question is asking for a single linear function that models the entire relationship. You don't need to figure out the rate yourself. You just need two data points and Desmos will give you the equation.
The Desmos Way (10 seconds)
The problem gives you two points. Read carefully:
- x is hours, y is cost
- 2 hours costs $240 so that's the point (2, 240)
- 6 hours costs $600 so that's the point (6, 600)
Open Desmos. Create a table. Put in those two points. Then click the regression button.
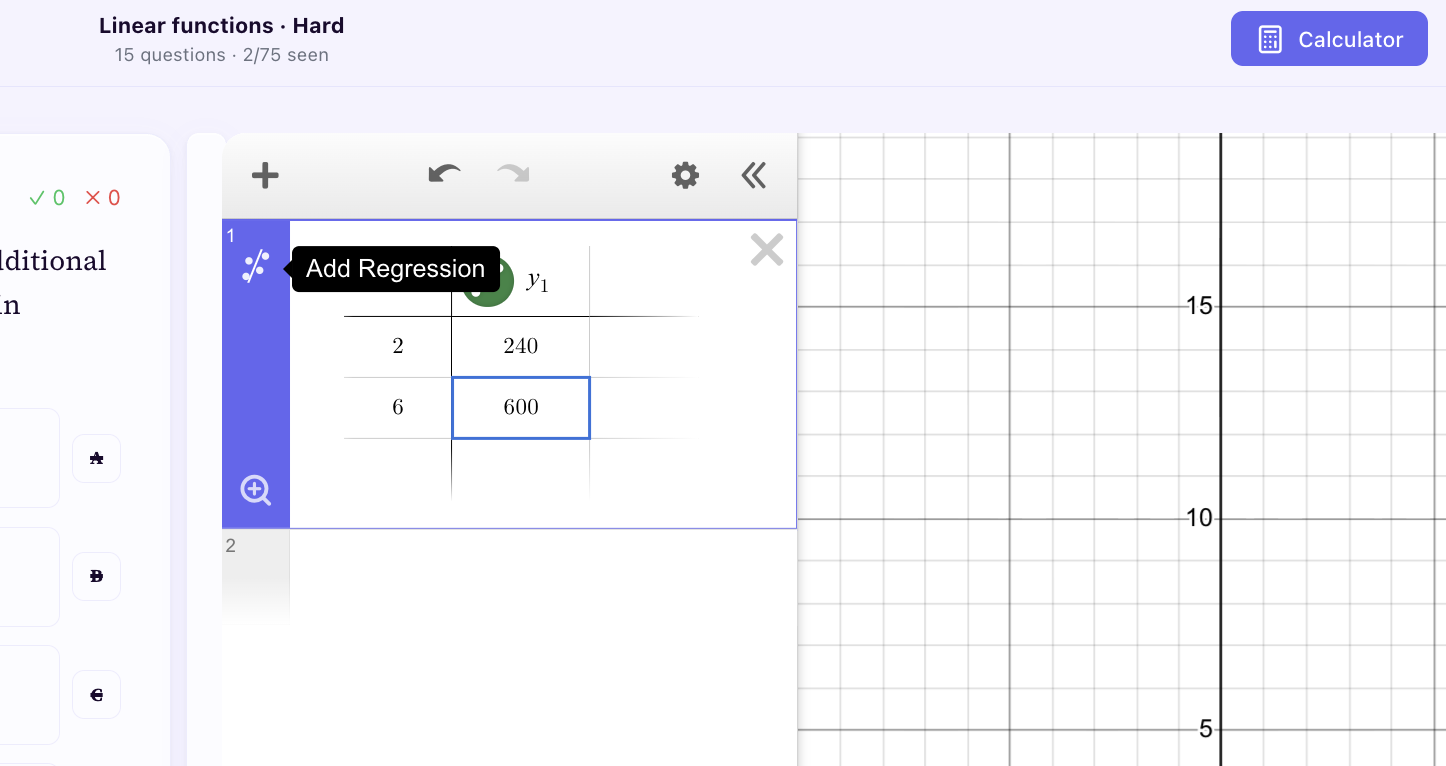
That's it. Desmos gives you the equation: y = 90x + 60. Match that to the answer choices and you've got B.
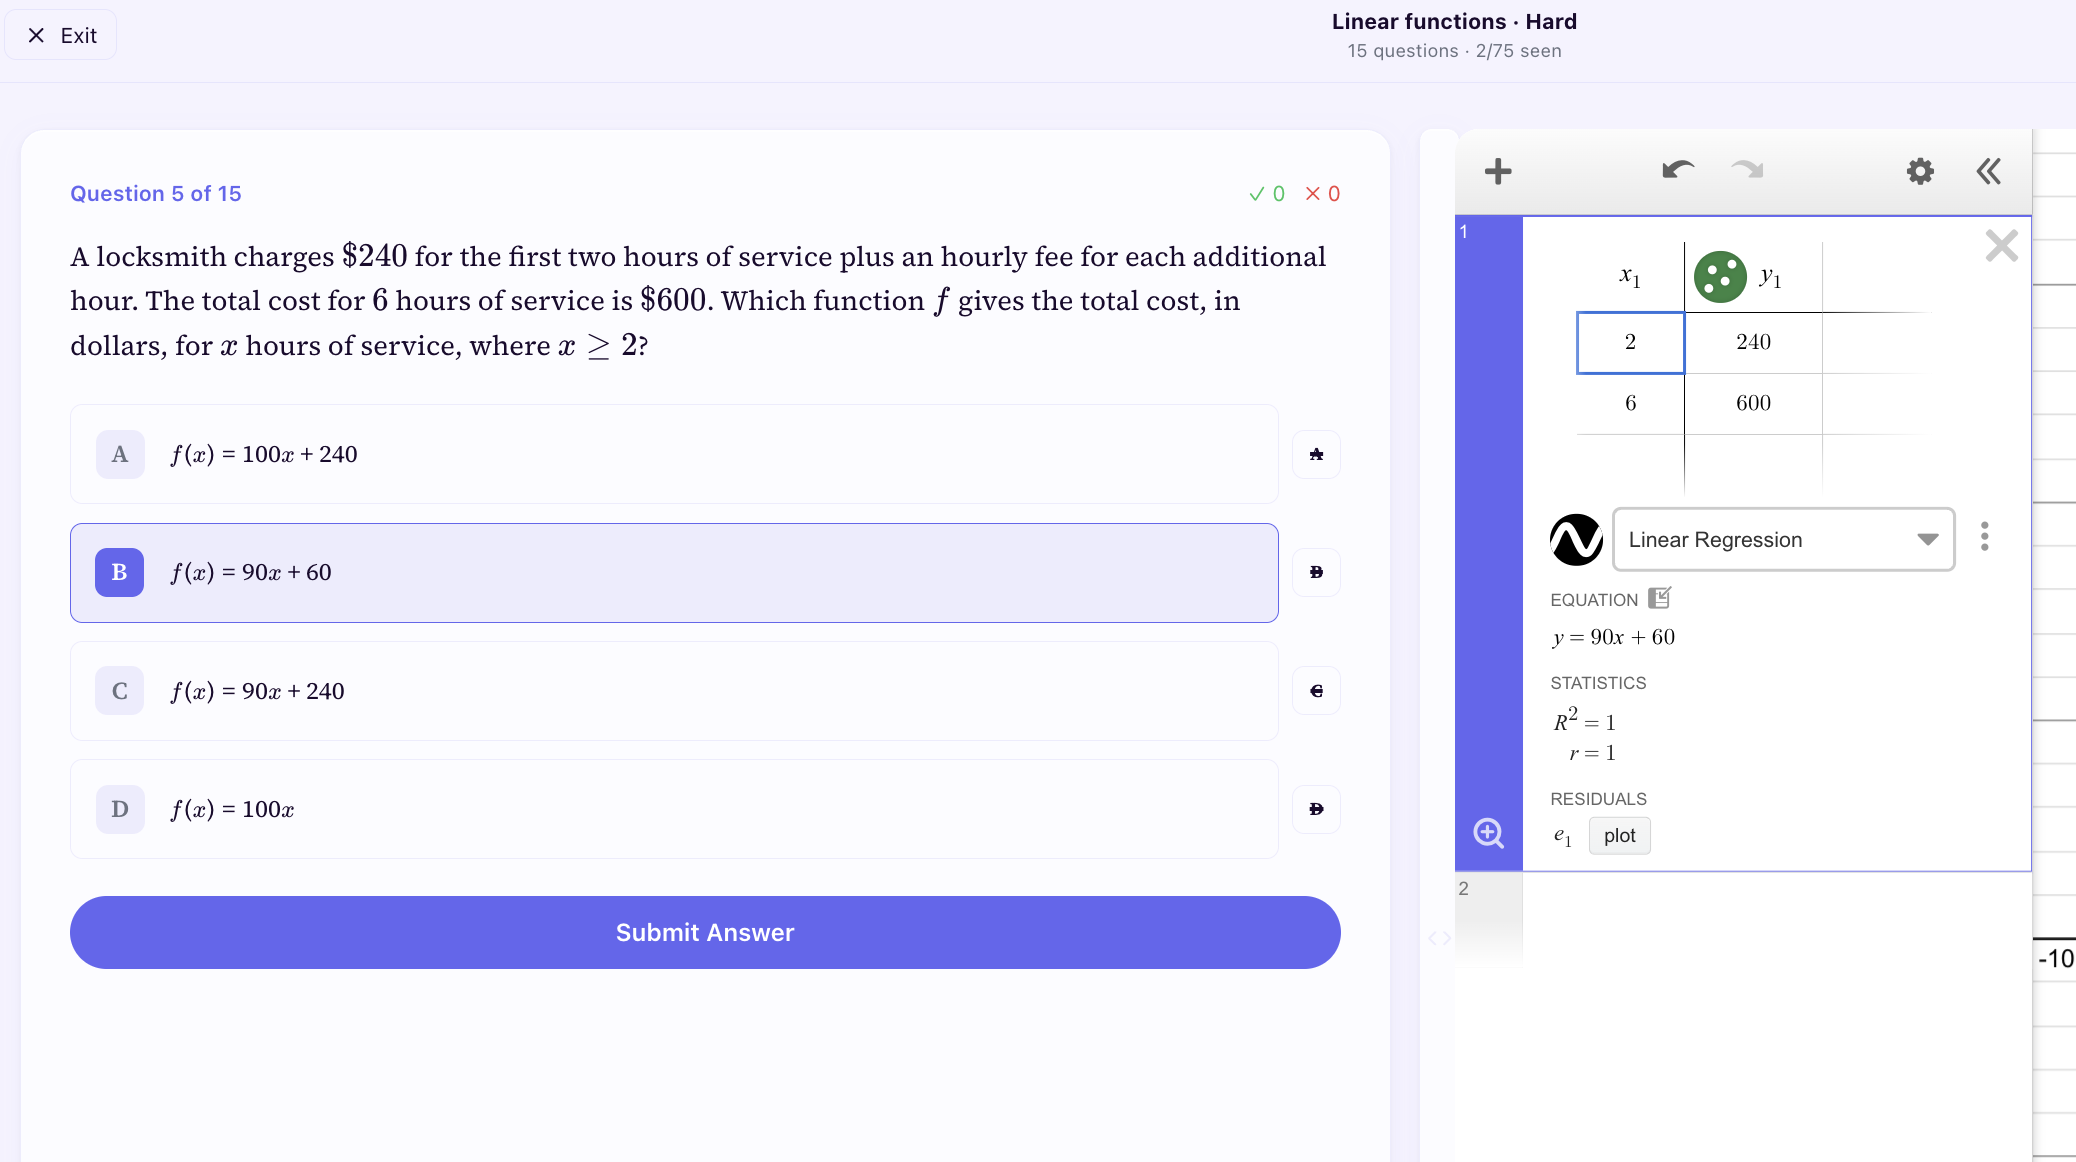
No algebra. No figuring out rates. No breaking the problem into pieces. Two points, a table, one button. Done.
Why This Matters
This exact pattern shows up all over the SAT. Anytime a problem gives you a relationship between two variables and asks you to find the equation, you can use this approach. Word problems about costs, distances, rates, growth. If you can pull two data points from the problem you can get the equation from Desmos in seconds.
The students who know this save 2-3 minutes per problem compared to doing it algebraically. Across the whole test that adds up to a lot of extra time. And you eliminate the chance of making an algebra mistake because you're not doing any algebra. This is just one example of the massive advantage Desmos gives you on the SAT.
Practice More of These
This type of question shows up most often in Linear Functions at the Hard difficulty level. On Sigma Prep you can practice dozens of problems exactly like this one. Each one comes with a video explanation showing the Desmos approach so you can see it done step by step.
Here's what it looks like:
The more you practice, the faster you get at spotting when to use regression. Eventually it becomes automatic. You see a word problem with two data points and you immediately know to open a table in Desmos.
Want to try it yourself? Take the free Diagnostic Quiz and see if you run into any problems where Desmos would have been faster. When you get one wrong watch the video explanation. You'll see how many SAT problems can be solved this way. No payment required.